
Level:
Correct: 0
Incorrect: 0
Marks: 0/0
Exam Practice
Course:
Topics:
AQA GCSE Statistics (Higher Paper 1) Smart practice A mixed round aimed at your weak spots
Unit 1
Planning and collecting data
Unit 2
Representing data
Section C: C1a (tabulation, tally, pictogram); Section E: E3d
Tabulation, tallies, pictograms and tables of data
Section C: C1a (pie chart), C1b (comparative pie chart)
Pie charts and comparative pie charts
Section C: C1a (stem and leaf diagram)
Stem and leaf diagrams
Section C: C2 (bar charts, bar line charts, line charts, frequency polygons)
Bar charts, line charts and frequency polygons
Section C: C2 (cumulative frequency charts)
Cumulative frequency diagrams
Section C: C2 (histograms), C3b
Histograms and frequency density
Section C: C2 (box plots); Section D: D3b; Section E: E5b
Box plots and outliers
Unit 3
Summarising data
Section D: D1a (mode, median, arithmetic mean)
Mode, median and mean
Section D: D1a (weighted mean, geometric mean), D1b
Weighted mean, geometric mean and choosing an average
Section D: D2; Section E: E5a
Skewness
Section D: D3a (range, quartiles, IQR, percentiles, interpercentile and interdecile range)
Range, quartiles, percentiles and interdecile range
Section D: D3a (standard deviation)
Standard deviation
Section C: C2 (time series); Section D: D1a (mean seasonal variation), D4; Section E: E6
Time series, moving averages and seasonal variation
Section C: C2 (scatter charts); Section D: D5
Scatter diagrams, lines of best fit and regression lines
Section D: D6; Section E: E9a, E9b, E9c
Spearman's rank correlation coefficient
Unit 4
Probability
Unit 5
Interpreting and evaluating results
Unit 6
Statistical enquiry cycle
3.6 Statistical enquiry cycle: 3.6.1 Initial planning, 3.6.2 Data collection
Statistical enquiry cycle: planning and data collection
3.6 Statistical enquiry cycle: 3.6.3 Processing and presentation, 3.6.4 Interpretation, 3.6.5 Evaluation
Statistical enquiry cycle: analysis and evaluation
Avg
score:
–
Topics
done:
0/39

Index numbers

Practise 17 exam-style questions on Index numbers for AQA GCSE Statistics (Higher Paper 1). Write your answer as you would in the exam and get it marked in seconds against the mark scheme, point by point, with the Study Helper on hand if you get stuck.

  • 17 questions
  • 1–5 marks each
  • Instant marking
  • No sign-up needed
17 questions, marked as you go

Sample questions with model answers

Here are 4 of the questions in this topic, each with a model answer, an explanation of why it earns the marks and the mark scheme an examiner would use.

Question 1

1 mark

Using 2018 as the base year, the index number for the price of a concert ticket was 120 in 2022 and 132 in 2024.

By what percentage did the price of the ticket increase from 2022 to 2024?

Choose your answer.

  • 10%
  • 12%
  • 32%
  • 110%

Model answer

10%

Explanation

Neither year is the base year, so compare the two index numbers: 132 ÷ 120 = 1.1, an increase of 10%. A rise of 12 index points is only 12% when it is measured from 100.

Mark scheme
  1. 1 mark

    B1 for 10%

    Any other answer, or more than one answer, scores B0. 132 ÷ 120 = 1.1. 12% is the difference in index points treated as a percentage; 32% is the increase from the base year 2018; 110% is 132 ÷ 120 written as a percentage.
Question 2

2 marks

A garden centre sells a small garden shed.
Using 2018 as the base year, the index number for the price of the shed was 92 in 2021 and 115 in 2025.

In 2021 the shed cost £276.

Work out the price of the shed in 2025.

Model answer

Neither year is the base year, so use the ratio of the index numbers:
price in 2025 \(= 276 \times \dfrac{115}{92} = 276 \times 1.25 = £345\)

Explanation

The prices are in the same ratio as their index numbers, so multiply £276 by 115 ÷ 92 (or find the 2018 price, £300, first). The index rose by 23 points, but that is a 25% rise from 92, not a 23% rise; 23% gives the wrong answer £339.48.

Mark scheme
  1. 1 mark

    M1 for \(276 \times \dfrac{115}{92}\) or 276 × 1.25

    oe, eg 276 ÷ 0.92 × 1.15 (finding the 2018 price, £300, first)

  2. 1 mark

    A1 for (£)345

    Correct answer with no working scores 2 marks. 276 × 1.23 = 339.48 (treating the 23 index points as 23%) scores M0A0. 276 × 1.15 = 317.40 (treating 2021 as the base year) scores M0A0.

Question 3

3 marks

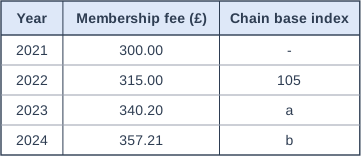
The table shows the annual membership fee for a gym from 2021 to 2024, and some chain base index numbers.

In a chain base index, the index number for each year uses the year before as the base year.

Work out the values of a and b.
Then write down the year in which the fee increased by the greatest percentage.

Table with columns "Year", "Membership fee (£)", "Chain base index". Year: 2021; Membership fee (£): 300.00; Chain base index: - | Year: 2022; Membership fee (£): 315.00; Chain base index: 105 | Year: 2023; Membership fee (£): 340.20; Chain base index: a | Year: 2024; Membership fee (£): 357.21; Chain base index: b.

Model answer

a \(= \dfrac{340.20}{315} \times 100 = 108\)
b \(= \dfrac{357.21}{340.20} \times 100 = 105\)
The chain base index numbers are 105, 108 and 105, so the greatest percentage increase (8%) was in 2023.

Explanation

Each chain base index compares a year with the year before, so it shows that year's percentage change directly: 108 means an 8% rise on the previous year. The year with the largest chain base index had the largest percentage increase. Using 2021 as the base for every year gives fixed-base indices instead.

Mark scheme
  1. 1 mark

    M1 for \(\dfrac{340.20}{315} \times 100\) or \(\dfrac{357.21}{340.20} \times 100\)

    oe

  2. 1 mark

    A1 for a = 108 and b = 105

    Both values correct. Using 2021 as a fixed base gives 113.4 and 119.07: M0A0, and the final mark cannot be followed through from fixed-base values.

  3. 1 mark

    B1ft for 2023

    ft their chain base values of a and b compared with 105 for 2022 (the year with the greatest chain base index number). 2024 chosen from the fixed-base values 113.4 and 119.07 scores B0.

Question 4

3 marks

A bakery calculates a weighted index number for its costs in 2024, using 2020 as the base year.
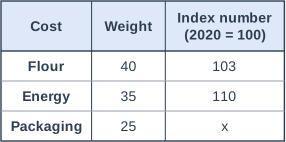
The table shows the weights and the index numbers for its three costs.

The weighted index number for the bakery's costs in 2024 is 106

Work out the value of x.

Table with columns "Cost", "Weight", "Index number (2020 = 100)". Cost: Flour; Weight: 40; Index number (2020 = 100): 103 | Cost: Energy; Weight: 35; Index number (2020 = 100): 110 | Cost: Packaging; Weight: 25; Index number (2020 = 100): x.

Model answer

\(\dfrac{40 \times 103 + 35 \times 110 + 25x}{40 + 35 + 25} = 106\)
\(4120 + 3850 + 25x = 10\,600\)
\(25x = 2630\)
\(x = 105.2\)

Explanation

Write the weighted index formula with x as the unknown index, set it equal to 106 and solve. The weights add up to 100, so the products must add up to 10 600. Taking the plain mean of the three index numbers ignores the weights.

Mark scheme
  1. 1 mark

    M1 for \(\dfrac{40 \times 103 + 35 \times 110 + 25x}{100} = 106\) or 4120 + 3850 + 25x = 10 600

    oe. A correct equation.

  2. 1 mark

    M1dep for 25x = 2630 or \(x = \dfrac{10\,600 - 7970}{25}\)

    oe

  3. 1 mark

    A1 for 105.2

    Correct answer with no working scores 3 marks. Trial and improvement (trying values of x in the weighted index with all three weights) may be used, but the final answer must be correct for any marks: then 3 marks. Ignoring the weights, (103 + 110 + x) ÷ 3 = 106 gives 105: M0M0A0.

Ready to try the rest? Every answer you write is marked against the mark scheme, so you can see exactly where the marks are.

Study Helper Hints first, answers after you try

Stuck on this one? Ask for a hint and I’ll point you in the right direction, without giving the answer away. Once you’ve checked your answer, I’ll show you how the marks are awarded.