
Level:
Correct: 0
Incorrect: 0
Marks: 0/0
Exam Practice
Course:
Topics:
AQA GCSE Statistics (Higher Paper 1) Smart practice A mixed round aimed at your weak spots
Unit 1
Planning and collecting data
Unit 2
Representing data
Section C: C1a (tabulation, tally, pictogram); Section E: E3d
Tabulation, tallies, pictograms and tables of data
Section C: C1a (pie chart), C1b (comparative pie chart)
Pie charts and comparative pie charts
Section C: C1a (stem and leaf diagram)
Stem and leaf diagrams
Section C: C2 (bar charts, bar line charts, line charts, frequency polygons)
Bar charts, line charts and frequency polygons
Section C: C2 (cumulative frequency charts)
Cumulative frequency diagrams
Section C: C2 (histograms), C3b
Histograms and frequency density
Section C: C2 (box plots); Section D: D3b; Section E: E5b
Box plots and outliers
Unit 3
Summarising data
Section D: D1a (mode, median, arithmetic mean)
Mode, median and mean
Section D: D1a (weighted mean, geometric mean), D1b
Weighted mean, geometric mean and choosing an average
Section D: D2; Section E: E5a
Skewness
Section D: D3a (range, quartiles, IQR, percentiles, interpercentile and interdecile range)
Range, quartiles, percentiles and interdecile range
Section D: D3a (standard deviation)
Standard deviation
Section C: C2 (time series); Section D: D1a (mean seasonal variation), D4; Section E: E6
Time series, moving averages and seasonal variation
Section C: C2 (scatter charts); Section D: D5
Scatter diagrams, lines of best fit and regression lines
Section D: D6; Section E: E9a, E9b, E9c
Spearman's rank correlation coefficient
Unit 4
Probability
Unit 5
Interpreting and evaluating results
Unit 6
Statistical enquiry cycle
3.6 Statistical enquiry cycle: 3.6.1 Initial planning, 3.6.2 Data collection
Statistical enquiry cycle: planning and data collection
3.6 Statistical enquiry cycle: 3.6.3 Processing and presentation, 3.6.4 Interpretation, 3.6.5 Evaluation
Statistical enquiry cycle: analysis and evaluation
Avg
score:
–
Topics
done:
0/39

Statistical enquiry cycle: analysis and evaluation

Practise 19 exam-style questions on Statistical enquiry cycle: analysis and evaluation for AQA GCSE Statistics (Higher Paper 1). Write your answer as you would in the exam and get it marked in seconds against the mark scheme, point by point, with the Study Helper on hand if you get stuck.

  • 19 questions
  • 1–6 marks each
  • Instant marking
  • No sign-up needed
19 questions, marked as you go

Sample questions with model answers

Here are 4 of the questions in this topic, each with a model answer, an explanation of why it earns the marks and the mark scheme an examiner would use.

Question 1

1 mark

Mia's hypothesis is 'Adults who walk to work have a lower resting pulse rate than adults who drive to work.'
She measures the resting pulse rates of 12 adults who walk to work and 12 adults who drive to work, all from her workplace.
The median pulse rates are 64 beats per minute for those who walk and 71 beats per minute for those who drive.

Which statement is correct?

Choose your answer.

  • Her results support the hypothesis, but larger samples would make her conclusion more reliable
  • Her results prove that walking to work lowers a person's pulse rate
  • Her results show that every walker has a lower pulse rate than every driver
  • Her results show that the hypothesis is true for all adults in the country

Model answer

Her results support the hypothesis, but larger samples would make her conclusion more reliable

Explanation

The walkers' median is lower, so the results support the hypothesis, but samples of 12 from one workplace are small, so the conclusion is not very reliable. The results cannot show that walking causes a lower pulse rate (other factors, such as general fitness, may explain it), medians do not describe every individual, and a sample from one workplace cannot be generalised to all adults in the country.

Mark scheme
  1. 1 mark

    B1 for Her results support the hypothesis, but larger samples would make her conclusion more reliable

    Accept any clear indication of this option. Any other answer, or more than one answer, scores B0.
Question 2

2 marks

A council tested the hypothesis 'Journeys on the new bus route into the town centre are quicker than journeys on the old route.'
It timed 40 journeys on each route.

Old route: median 34 minutes, interquartile range 9 minutes
New route: median 29 minutes, interquartile range 4 minutes

Write two statements about these results for the council's newsletter.
The statements must be in context and easy to understand for readers who have not studied statistics.
One statement should be about the average journey time and one should be about how much the journey times vary.

Model answer

A typical journey on the new bus route is about 5 minutes quicker than a journey on the old route.

Journey times on the new route also vary much less from day to day, so passengers can be more confident about how long their journey will take.

Explanation

Communicating findings means choosing words that suit the audience. Newsletter readers may not know what a median or an interquartile range is, so explain what the numbers mean: 'a typical journey is 5 minutes quicker' and 'journey times are more predictable'. Each statement must still be accurate and in context.

Mark scheme
  1. 1 mark

    B1 for a statement about the average in context and in everyday language, eg a typical journey on the new route is about 5 minutes quicker than on the old route

    oe. Must compare the routes, refer to journey time, and use 'on average', 'typical' or 'usually'. 'The median of the new route is lower' B0 (technical, no interpretation). 'The new route is quicker' with no 'on average' or similar B0. Any values stated must be correct (5 minutes).

  2. 1 mark

    B1 for a statement about the variation in context and in everyday language, eg journey times on the new route vary less, so passengers can be more sure how long their journey will take

    oe. Accept 'journey times on the new route are more consistent / more predictable / more reliable'. 'The interquartile range of the new route is smaller' B0 (technical term with no interpretation). 'The new route's times vary more' B0 (wrong interpretation).

Question 3

3 marks

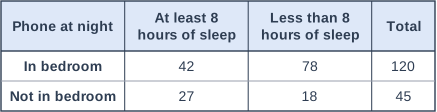
Ollie is testing the hypothesis 'Students who do not keep their phone in their bedroom at night are more likely to get at least 8 hours of sleep than students who do.'
He asked some Year 11 students where they keep their phone at night and how long they slept last night.
The table shows his results.

Use the table to decide whether the results support Ollie's hypothesis.
You must show your working.

Table with columns "Phone at night", "At least 8 hours of sleep", "Less than 8 hours of sleep", "Total". Phone at night: In bedroom; At least 8 hours of sleep: 42; Less than 8 hours of sleep: 78; Total: 120 | Phone at night: Not in bedroom; At least 8 hours of sleep: 27; Less than 8 hours of sleep: 18; Total: 45.

Model answer

Phone in bedroom: \(\dfrac{42}{120} = 0.35\), so 35% got at least 8 hours of sleep.
Phone not in bedroom: \(\dfrac{27}{45} = 0.6\), so 60% got at least 8 hours of sleep.

Yes, the results support Ollie's hypothesis: a greater proportion of the students who do not keep their phone in their bedroom got at least 8 hours of sleep (60% compared with 35%).

Explanation

The two groups are different sizes (120 and 45), so the numbers cannot be compared directly: you must compare proportions or percentages. Comparing counts here gives the wrong conclusion, because 42 is more than 27 even though it is a much smaller share of its group. The results suggest a link, but they do not show that the phone causes less sleep.

Mark scheme
  1. 1 mark

    M1 for one correct proportion of students who got at least 8 hours of sleep, eg \(\dfrac{42}{120}\) (= 0.35 or 35%) or \(\dfrac{27}{45}\) (= 0.6 or 60%)

    oe. Accept the proportions who got less than 8 hours: \(\dfrac{78}{120}\) (= 0.65 or 65%) or \(\dfrac{18}{45}\) (= 0.4 or 40%).

  2. 1 mark

    A1 for both proportions correct: 35% (phone in bedroom) and 60% (phone not in bedroom), or 65% and 40% for less than 8 hours

    oe (fractions or decimals).

  3. 1 mark

    B1ft for Yes, the results support the hypothesis, because a greater proportion of the students who do not keep their phone in their bedroom got at least 8 hours of sleep (60% compared with 35%)

    ft their proportions. Must compare proportions or percentages, not numbers: 'More students with a phone in their bedroom got at least 8 hours (42 compared with 27), so it is not supported' scores 0. 'Yes' with no working scores 0 (the question says 'You must show your working').

Question 4

5 marks

Zara is testing the hypothesis 'The new version of an app loads more consistently than the old version.'
For the old version, the load times had a mean of 2.4 seconds and a standard deviation of 0.62 seconds.
Zara then timed the new version loading 10 times. Here are her results, in seconds.

1.8   2.1   1.9   2.0   2.2   1.7   2.0   2.1   1.9   2.3

Standard deviation \(= \sqrt{\dfrac{\sum x^2}{n} - \left(\dfrac{\sum x}{n}\right)^2}\)

Calculate the mean and the standard deviation of the load times for the new version.
Give the standard deviation to 2 decimal places.
Use your results to compare the two versions, and say whether they support Zara's hypothesis.

Model answer

\(\sum x = 20\), so the mean \(= \dfrac{20}{10} = 2\) seconds.
\(\sum x^2 = 40.3\)
Standard deviation \(= \sqrt{\dfrac{40.3}{10} - 2^2} = \sqrt{0.03} = 0.1732...\), which is 0.17 seconds to 2 decimal places.

The new version's load times are much more consistent than the old version's, because the standard deviation is much smaller (0.17 seconds compared with 0.62 seconds), so the results support Zara's hypothesis.
The new version also loads more quickly on average (mean 2 seconds compared with 2.4 seconds).

Explanation

The standard deviation measures how spread out values are around the mean, so it is the measure that tests a hypothesis about consistency: a smaller standard deviation means more consistent load times. Use the divide-by-n formula given (a calculator's σx); the sample key (sx, dividing by n - 1) gives 0.18. Then interpret both measures in context and link the consistency result to the hypothesis.

Mark scheme
  1. 1 mark

    B1 for mean = 2 (seconds)

    Accept 2.0. \(\sum x = 20\) may be seen.

  2. 1 mark

    M1 for \(\sqrt{\dfrac{40.3}{10} - 2^2}\) oe, or \(\sqrt{\dfrac{0.3}{10}}\) using \(\sum (x - \bar{x})^2 = 0.3\)

    \(\sum x^2 = 40.3\). Accept equivalent working. May be implied by a correct answer (eg from a calculator's statistics mode).

  3. 1 mark

    A1 for 0.17 [0.17, 0.174]

    Accept 0.173 or 0.1732... (more accurate values in the range). A calculator's population standard deviation (σx) gives this value. The n - 1 formula (sx) gives 0.18 (0.1825...): M0A0, but the comparison marks can still be awarded (ft). A correct answer with no working scores M1A1.

  4. 1 mark

    B1ft for a comparison of consistency linked to the hypothesis, eg the new version's load times are more consistent (less varied), because its standard deviation is smaller (0.17 compared with 0.62 seconds), so the results support the hypothesis

    ft their standard deviation compared with 0.62. Must interpret the standard deviation (consistent, varied or spread) AND link to the hypothesis. Accept 'less spread out' for 'more consistent'. 'The new version has a smaller standard deviation' alone B0.

  5. 1 mark

    B1ft for a comparison of the averages in context, eg the new version loads more quickly on average (mean 2 seconds compared with 2.4 seconds)

    ft their mean compared with 2.4. Must refer to load time or speed and to the average. Accept 'loads faster, on average'. 'The new mean is lower' B0.

Ready to try the rest? Every answer you write is marked against the mark scheme, so you can see exactly where the marks are.

Study Helper Hints first, answers after you try

Stuck on this one? Ask for a hint and I’ll point you in the right direction, without giving the answer away. Once you’ve checked your answer, I’ll show you how the marks are awarded.