Practise 18 exam-style questions on Mode, median and mean for AQA GCSE Statistics (Higher Paper 1). Write your answer as you would in the exam and get it marked in seconds against the mark scheme, point by point, with the Study Helper on hand if you get stuck.
18 questions
1–5 marks each
Instant marking
No sign-up needed
18 questions, marked as you go
Sample questions with model answers
Here are 4 of the questions in this topic, each with a model answer, an explanation of why it earns the marks and the mark scheme an examiner would use.
Question 1
1 mark
Kwame recorded the journey times of 40 buses in a grouped frequency table. He used the table to calculate the mean journey time.
Explain why his answer is only an estimate of the mean.
Model answer
The data are grouped, so Kwame does not know the exact journey times. He has to assume that the times in each class are at the midpoint of the class, so his mean is only an estimate.
Explanation
From a grouped frequency table you only know how many values are in each class, not what they are. Using each class midpoint assumes the values are spread evenly around it, which may not be true. Answers that just repeat 'it is an estimate' do not explain why.
Mark scheme
1 mark
B1 for the data have been grouped, so the exact journey times are not known / he has to use the midpoints of the classes in place of the actual times
oe. Accept 'it assumes every time is at the midpoint of its class'. 'Because it is an estimate' B0. 'Because he rounded his answer' B0. 'The data could be wrong' B0.
Question 2
2 marks
Lewis has taken 6 tests. His scores in five of the tests were
72 65 81 58 77
The mean of his scores in all 6 tests was 70.
Work out his score in the sixth test.
Model answer
Total of all 6 scores = 70 × 6 = 420 Total of the five scores = 72 + 65 + 81 + 58 + 77 = 353 Sixth score = 420 - 353 = 67
Explanation
Working backwards from a mean: mean × number of values gives the total of all the values, and the missing value is that total minus the values you know. A common error is to find the mean of the five known scores instead.
Mark scheme
1 mark
M1 for \(70 \times 6\) (= 420) or \(420 - 353\)
oe, eg an equation \(\dfrac{353 + x}{6} = 70\).
1 mark
A1 for 67
Correct answer with no working scores 2. 70.6 (353 ÷ 5) M0A0. Using 70 × 5 = 350 M0A0.
Question 3
3 marks
A youth club has 25 members. Their mean age is 14.2 years.
Five new members join the club. The mean age of all 30 members is now 14.5 years.
Work out the mean age of the five new members.
Model answer
Total age of the 30 members = 30 × 14.5 = 435 years Total age of the original 25 members = 25 × 14.2 = 355 years Total age of the 5 new members = 435 - 355 = 80 years Mean age of the new members = 80 ÷ 5 = 16 years
Explanation
Change each mean into a total by multiplying by the number of people. The difference between the totals is the combined age of the new members, which is then divided by 5. A common error is to treat the two means as if they could be subtracted or averaged directly.
Mark scheme
1 mark
M1 for \(30 \times 14.5\) (= 435) or \(25 \times 14.2\) (= 355)
oe
1 mark
M1dep for \(\dfrac{435 - 355}{5}\) or \(\dfrac{80}{5}\)
oe
1 mark
A1 for 16 (years)
Correct answer with no working scores 3. 80 (the total age of the new members) M1M0A0. 14.8 (from 2 × 14.5 - 14.2) M0M0A0.
Question 4
4 marks
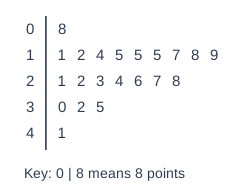
The stem-and-leaf diagram shows the numbers of points scored by a basketball player in 21 games.
Work out the mode, the median and the mean of the numbers of points. Give the mean to 1 decimal place.
Model answer
Values in order: 8, 11, 12, 14, 15, 15, 15, 17, 18, 19, 21, 22, 23, 24, 26, 27, 28, 30, 32, 35, 41 Mode = 15 points (it appears three times) Median = the \(\dfrac{21 + 1}{2} = 11\)th value = 21 points Sum = 453, so mean = 453 ÷ 21 = 21.571... = 21.6 points (to 1 decimal place)
Explanation
A stem-and-leaf diagram is already ordered, so the median can be counted directly (the 11th of 21 values) and the mode is the most repeated leaf on its stem. For the mean, rebuild each full value (stem and leaf) before adding. A common error is to give just the leaf, or to add the leaves only.
Mark scheme
1 mark
B1 for mode 15
'1 | 5' or '5' (the leaf) B0. 3 (the frequency) B0.
1 mark
B1 for median 21
The 11th value.
1 mark
M1 for \(\dfrac{453}{21}\)
oe. Allow one error in the sum of the 21 values for M1.
1 mark
A1 for mean 21.6 [21.57, 21.6]
453/21 = 21.571... Correct answers with no working score full marks.
Ready to try the rest? Every answer you write is marked against the mark scheme, so you can see exactly where the marks are.
Ctrl + Enter to check
Study HelperHints first, answers after you try
Stuck on this one? Ask for a hint and I’ll point you in the right direction, without giving the answer away. Once you’ve checked your answer, I’ll show you how the marks are awarded.