
Level:
Correct: 0
Incorrect: 0
Marks: 0/0
Exam Practice
Course:
Topics:
AQA GCSE Statistics (Higher Paper 1) Smart practice A mixed round aimed at your weak spots
Unit 1
Planning and collecting data
Unit 2
Representing data
Section C: C1a (tabulation, tally, pictogram); Section E: E3d
Tabulation, tallies, pictograms and tables of data
Section C: C1a (pie chart), C1b (comparative pie chart)
Pie charts and comparative pie charts
Section C: C1a (stem and leaf diagram)
Stem and leaf diagrams
Section C: C2 (bar charts, bar line charts, line charts, frequency polygons)
Bar charts, line charts and frequency polygons
Section C: C2 (cumulative frequency charts)
Cumulative frequency diagrams
Section C: C2 (histograms), C3b
Histograms and frequency density
Section C: C2 (box plots); Section D: D3b; Section E: E5b
Box plots and outliers
Unit 3
Summarising data
Section D: D1a (mode, median, arithmetic mean)
Mode, median and mean
Section D: D1a (weighted mean, geometric mean), D1b
Weighted mean, geometric mean and choosing an average
Section D: D2; Section E: E5a
Skewness
Section D: D3a (range, quartiles, IQR, percentiles, interpercentile and interdecile range)
Range, quartiles, percentiles and interdecile range
Section D: D3a (standard deviation)
Standard deviation
Section C: C2 (time series); Section D: D1a (mean seasonal variation), D4; Section E: E6
Time series, moving averages and seasonal variation
Section C: C2 (scatter charts); Section D: D5
Scatter diagrams, lines of best fit and regression lines
Section D: D6; Section E: E9a, E9b, E9c
Spearman's rank correlation coefficient
Unit 4
Probability
Unit 5
Interpreting and evaluating results
Unit 6
Statistical enquiry cycle
3.6 Statistical enquiry cycle: 3.6.1 Initial planning, 3.6.2 Data collection
Statistical enquiry cycle: planning and data collection
3.6 Statistical enquiry cycle: 3.6.3 Processing and presentation, 3.6.4 Interpretation, 3.6.5 Evaluation
Statistical enquiry cycle: analysis and evaluation
Avg
score:
–
Topics
done:
0/39

Problems with data, cleaning data and control groups

Practise 15 exam-style questions on Problems with data, cleaning data and control groups for AQA GCSE Statistics (Higher Paper 1). Write your answer as you would in the exam and get it marked in seconds against the mark scheme, point by point, with the Study Helper on hand if you get stuck.

  • 15 questions
  • 1–5 marks each
  • Instant marking
  • No sign-up needed
15 questions, marked as you go

Sample questions with model answers

Here are 4 of the questions in this topic, each with a model answer, an explanation of why it earns the marks and the mark scheme an examiner would use.

Question 1

1 mark

A sports scientist wants to find out whether a sports drink taken before a 10 km cycling time trial helps cyclists to ride faster.
She times 15 cyclists riding 10 km without the drink one day, and times them again after taking the drink a week later.

Name one extraneous variable that could affect her results.

Model answer

The weather: a strong headwind on one of the days would make the cyclists' times slower, whether or not they had taken the drink.

Explanation

An extraneous variable is any variable, other than the one being tested, that could affect the results. Because the two rides are a week apart, the weather, the cyclists' fitness and how tired they are could all change, so a difference in times might not be caused by the drink.

Mark scheme
  1. 1 mark

    B1 for any variable other than the drink that could affect the 10 km times, eg the weather (wind speed, rain or temperature) / the cyclists' fitness changing during the week / tiredness / the road or course conditions / the bikes or tyre pressures / the time of day / what the cyclists ate / practice or motivation

    oe. Accept 'the cyclists' fitness' or 'how tired the cyclists are'. Do not accept 'the drink', 'the time taken' (this is what is measured) or 'the cyclists' with no characteristic given. Ignore any non-contradictory or irrelevant statements.
Question 2

2 marks

A football club's online survey about its stadium facilities has 20 questions. 300 people start the survey, but only 210 of them answer all 20 questions. Many people stop part of the way through.

Give one problem this causes when the results are analysed.
Give one way the survey could be changed to reduce the number of incomplete responses.

Model answer

Problem: the questions near the end are answered by fewer people, and the people who finish may be the fans with the strongest views about the stadium, so the results for those questions may be biased.
Change: cut the survey down to fewer questions and put the most important questions first.

Explanation

Incomplete responses mean that different questions have different numbers of answers, and the people who give up are often different from those who finish. Shorter questionnaires, with the key questions first, are the most effective way to reduce drop-out.

Mark scheme
  1. 1 mark

    B1 for a valid problem, eg the later questions are answered by fewer people, so their results are based on smaller samples / the people who finish may not be typical (eg they may be the most regular or most unhappy fans), so results for the later questions may be biased / results for different questions are based on different groups of people, so they are hard to compare

    oe. 'There is less data' with no link to the questions or the people B0.

  2. 1 mark

    B1 for a valid change, eg make the survey shorter / put the most important questions first / show a progress bar / offer an incentive for completing it

    oe. 'Make all questions compulsory' B0 (people would still stop, and this may increase drop-out). 'Ask more people' B0. 'Use face-to-face interviews instead' B0 (the question asks how the survey could be changed).

Question 3

3 marks

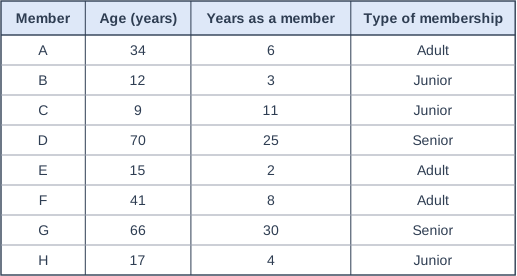
A sports club records information about its members. Junior membership is for members under 18 years old, senior membership is for members aged 65 and over, and adult membership is for everyone else.

The table shows the records for eight members.

Identify the two members whose records contain values that are not consistent with other values. Explain why each record is inconsistent, and say how the club should deal with these records.

Table with columns "Member", "Age (years)", "Years as a member", "Type of membership". Member: A; Age (years): 34; Years as a member: 6; Type of membership: Adult | Member: B; Age (years): 12; Years as a member: 3; Type of membership: Junior | Member: C; Age (years): 9; Years as a member: 11; Type of membership: Junior | Member: D; Age (years): 70; Years as a member: 25; Type of membership: Senior | Member: E; Age (years): 15; Years as a member: 2; Type of membership: Adult | Member: F; Age (years): 41; Years as a member: 8; Type of membership: Adult | Member: G; Age (years): 66; Years as a member: 30; Type of membership: Senior | Member: H; Age (years): 17; Years as a member: 4; Type of membership: Junior.

Model answer

Member C is 9 years old but has been a member for 11 years, which is impossible.
Member E is 15 years old, so should be a junior member, but is recorded as an adult member.
The club should check these records against the original application forms, or ask the members, and correct them. If the correct values cannot be found, these records should be left out of any analysis that uses the inconsistent values.

Explanation

Cleaning data includes checking that values agree with each other, not just that each value is sensible on its own. Here the age, the length of membership and the type of membership must fit together. Inconsistent values should be checked and corrected where possible, rather than simply deleted.

Mark scheme
  1. 1 mark

    B1 for Member C, because a 9-year-old cannot have been a member for 11 years

    oe. Must give the reason.

  2. 1 mark

    B1 for Member E, because a 15-year-old should have junior membership, not adult membership

    oe. Must give the reason. If more than two members are identified, deduct 1 mark for each incorrect one (minimum 0 for these two marks).

  3. 1 mark

    B1 for check the original records (or ask the members) and correct the values; if they cannot be checked, leave these records out of any analysis that uses the values

    oe. Accept 'contact the members to find the correct values'. 'Delete them' with no attempt to check first: condone. 'Ignore them' B0 unless it is clear they are excluded from the analysis.

Question 4

4 marks

A school council asks students to fill in an online form. One question on the form is

'Would you like the lunch break to be longer?'

Students type their answer into a box. 72 students fill in the form, and every one of them answers this question.
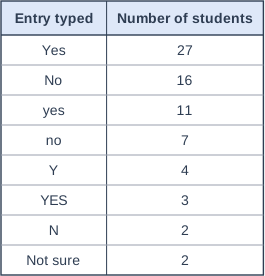
The council's spreadsheet counts how many students typed each different entry. The table shows the results.

A council member says,
"Only 27 of the 72 students, 37.5%, want a longer lunch break, so most students do not want one."

Explain why the council member's conclusion is wrong, and work out the correct percentage of the 72 students who want a longer lunch break.
Then suggest how the question on the form could be changed so that this problem does not happen again.

Table with columns "Entry typed", "Number of students". Entry typed: Yes; Number of students: 27 | Entry typed: No; Number of students: 16 | Entry typed: yes; Number of students: 11 | Entry typed: no; Number of students: 7 | Entry typed: Y; Number of students: 4 | Entry typed: YES; Number of students: 3 | Entry typed: N; Number of students: 2 | Entry typed: Not sure; Number of students: 2.

Model answer

The same answer has been typed in different ways - Yes, yes, Y and YES - and the spreadsheet counts each of these as a different entry. The council member has only counted the 27 students who typed 'Yes' exactly.
Students who want a longer lunch break \(= 27 + 11 + 4 + 3 = 45\)
Percentage \(= \dfrac{45}{72} \times 100 = 62.5\%\)
So most students do want a longer lunch break, the opposite of the council member's conclusion.
Change: replace the box for typing with fixed options for students to choose from, such as tick boxes or a drop-down list with the options Yes, No and Not sure.

Explanation

When people type their own answers, the same answer can be entered in several ways, and a spreadsheet treats Yes, yes, Y and YES as four different entries. The data must be cleaned by recoding these as one category before counting: 45 of the 72 students, 62.5%, said yes. A common error is to leave out abbreviations such as Y, or to divide by the wrong total. Fixed response options stop the problem when the data are collected.

Mark scheme
  1. 1 mark

    B1 for the same answer has been typed in different ways (Yes, yes, Y and YES), and the spreadsheet counts each one as a different entry, so the council member has only counted the students who typed 'Yes' exactly

    oe. Accept 'yes, Y and YES also mean Yes, so they should be added to the 27' or 'the data need cleaning: the different spellings of Yes should be combined'. 'The spreadsheet is wrong' or 'the data are wrong' with no reference to the different ways of typing Yes B0.

  2. 1 mark

    M1 for \(27 + 11 + 4 + 3\) (= 45) or \(\dfrac{45}{72}\)

    oe. 45 seen implies M1. Leaving out one of the Yes entries (eg \(27 + 11 + 3 = 41\), giving 56.9%) M0A0.

  3. 1 mark

    A1 for 62.5(%)

    Accept 0.625 if it is clear that it is the proportion of the students. Correct answer with no working scores M1A1. \(\dfrac{45}{70} \times 100 = 64.3\%\) (leaving out the 2 'Not sure' students, when the question asks for the percentage of all 72) M1A0. Ignore a correct conclusion that most students do want a longer lunch break.

  4. 1 mark

    B1 for replacing the typed box with fixed response options that students choose from, eg tick boxes, buttons or a drop-down list: Yes / No / Not sure

    oe. The change must stop students typing their own answers. 'Tell students to type Yes or No' B0 (they could still type it in different ways). 'Clean the data' or 'combine the entries' B0 here (it does not change the form). 'Make it a closed question' B1 only if it is clear that students choose from given options.

Ready to try the rest? Every answer you write is marked against the mark scheme, so you can see exactly where the marks are.

Study Helper Hints first, answers after you try

Stuck on this one? Ask for a hint and I’ll point you in the right direction, without giving the answer away. Once you’ve checked your answer, I’ll show you how the marks are awarded.