
Level:
Correct: 0
Incorrect: 0
Marks: 0/0
Exam Practice
Course:
Topics:
AQA GCSE Statistics (Higher Paper 1) Smart practice A mixed round aimed at your weak spots
Unit 1
Planning and collecting data
Unit 2
Representing data
Section C: C1a (tabulation, tally, pictogram); Section E: E3d
Tabulation, tallies, pictograms and tables of data
Section C: C1a (pie chart), C1b (comparative pie chart)
Pie charts and comparative pie charts
Section C: C1a (stem and leaf diagram)
Stem and leaf diagrams
Section C: C2 (bar charts, bar line charts, line charts, frequency polygons)
Bar charts, line charts and frequency polygons
Section C: C2 (cumulative frequency charts)
Cumulative frequency diagrams
Section C: C2 (histograms), C3b
Histograms and frequency density
Section C: C2 (box plots); Section D: D3b; Section E: E5b
Box plots and outliers
Unit 3
Summarising data
Section D: D1a (mode, median, arithmetic mean)
Mode, median and mean
Section D: D1a (weighted mean, geometric mean), D1b
Weighted mean, geometric mean and choosing an average
Section D: D2; Section E: E5a
Skewness
Section D: D3a (range, quartiles, IQR, percentiles, interpercentile and interdecile range)
Range, quartiles, percentiles and interdecile range
Section D: D3a (standard deviation)
Standard deviation
Section C: C2 (time series); Section D: D1a (mean seasonal variation), D4; Section E: E6
Time series, moving averages and seasonal variation
Section C: C2 (scatter charts); Section D: D5
Scatter diagrams, lines of best fit and regression lines
Section D: D6; Section E: E9a, E9b, E9c
Spearman's rank correlation coefficient
Unit 4
Probability
Unit 5
Interpreting and evaluating results
Unit 6
Statistical enquiry cycle
3.6 Statistical enquiry cycle: 3.6.1 Initial planning, 3.6.2 Data collection
Statistical enquiry cycle: planning and data collection
3.6 Statistical enquiry cycle: 3.6.3 Processing and presentation, 3.6.4 Interpretation, 3.6.5 Evaluation
Statistical enquiry cycle: analysis and evaluation
Avg
score:
–
Topics
done:
0/39

Normal distribution, quality assurance and standardising

Practise 20 exam-style questions on Normal distribution, quality assurance and standardising for AQA GCSE Statistics (Higher Paper 1). Write your answer as you would in the exam and get it marked in seconds against the mark scheme, point by point, with the Study Helper on hand if you get stuck.

  • 20 questions
  • 1–5 marks each
  • Instant marking
  • No sign-up needed
20 questions, marked as you go

Sample questions with model answers

Here are 4 of the questions in this topic, each with a model answer, an explanation of why it earns the marks and the mark scheme an examiner would use.

Question 1

1 mark

The heights of dogs of one breed are normally distributed with a mean of 52 cm and a standard deviation of 3 cm.

Write down the approximate percentage of these dogs that have a height between 49 cm and 55 cm.

Model answer

49 cm and 55 cm are \(52 - 3\) and \(52 + 3\), one standard deviation either side of the mean.
About 68% of the dogs have a height between 49 cm and 55 cm.

Explanation

For a Normal distribution, about 68% (just over two thirds) of values lie within one standard deviation of the mean, and about 95% lie within two. Here 49 cm and 55 cm are exactly one standard deviation from the mean of 52 cm.

Mark scheme
  1. 1 mark

    B1 for 68% [\(66\dfrac{2}{3}\), 68.3]

    oe. Accept any value from \(66\dfrac{2}{3}\)% to 68.3%, eg 68%, 68.3%, 67%, 'just over two thirds', or the decimal 0.68 or fraction \(\dfrac{2}{3}\). 95% scores B0.
Question 2

2 marks

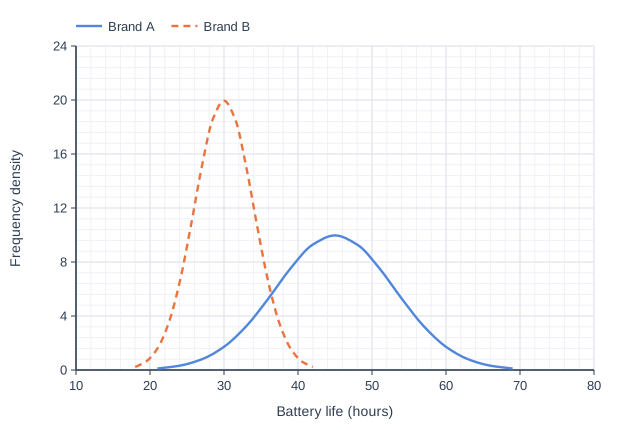
A toy company tested 200 batteries of Brand A and 200 batteries of Brand B.
It recorded how many hours each battery lasted in the same toy.
The battery lives for each brand are normally distributed.

The graph shows the distributions of the battery lives for the two brands.

Compare the battery lives of the two brands.

Line graph of frequency density (y-axis, 0 to 24) against battery life (hours) (x-axis, 10 to 80). "Brand A" is a smooth curve through (21, 0.11), (24, 0.32), (27, 0.79), (30, 1.72), (33, 3.24), (36, 5.3), (39, 7.53), (42, 9.29), (45, 9.97), (48, 9.29), (51, 7.53), (54, 5.3), (57, 3.24), (60, 1.72), (63, 0.79), (66, 0.32), (69, 0.11). "Brand B" (dashed) is a smooth curve through (18, 0.22), (19.5, 0.64), (21, 1.59), (22.5, 3.44), (24, 6.48), (25.5, 10.6), (27, 15.06), (28.5, 18.6), (30, 19.95), (31.5, 18.6), (33, 15.06), (34.5, 10.6), (36, 6.48), (37.5, 3.44), (39, 1.59), (40.5, 0.64), (42, 0.22).

Model answer

On average, Brand A batteries lasted longer: their mean battery life is about 45 hours, compared with about 30 hours for Brand B.
Brand B's battery lives were more consistent: their curve is narrower, so their battery lives were less spread out than Brand A's.

Explanation

The peak of a Normal curve is at the mean, and the width of the curve shows the standard deviation. Compare one average and one measure of spread, each in context: here one brand is better on average but the other is more consistent. Saying only that one curve is taller or further right describes the graph without interpreting it.

Mark scheme
  1. 1 mark

    B1 for a correct comparison of the average in context, eg Brand A batteries lasted longer on average (mean about 45 hours compared with about 30 hours)

    oe. Must use interpretive language such as 'on average' or 'generally', or name the mean (or median) and interpret it. 'Brand A's peak is further right' (no interpretation) scores B0. 'Brand A batteries last longer' without 'on average' oe scores B0. Any values stated must be correct (accept [44, 46] and [29, 31]).

  2. 1 mark

    B1 for a correct comparison of the spread in context, eg Brand B's battery lives were more consistent / less varied (their curve is narrower)

    oe. Accept 'Brand A's battery lives were more spread out'. Accept 'Brand B has the smaller standard deviation, so its battery lives were more consistent'. 'Brand B's curve is taller' or 'narrower' with no interpretation scores B0. Ignore any non-contradictory or irrelevant statements.

Question 3

3 marks

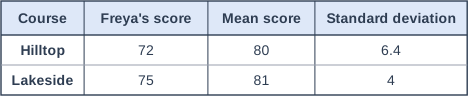
Freya played one round of golf on each of two courses in a junior golf competition.
In golf, a player's score is the number of shots they take, so a lower score is better.

The table shows Freya's score on each course, and the mean and standard deviation of the scores of all the players on that course.

On which course did Freya do better compared with the other players?
You must show your working.

Use the formula

\(\text{standardised score} = \dfrac{\text{value} - \text{mean}}{\text{standard deviation}}\)

Table with columns "Course", "Freya's score", "Mean score", "Standard deviation". Course: Hilltop; Freya's score: 72; Mean score: 80; Standard deviation: 6.4 | Course: Lakeside; Freya's score: 75; Mean score: 81; Standard deviation: 4.

Model answer

Hilltop: \(\dfrac{72 - 80}{6.4} = -1.25\)
Lakeside: \(\dfrac{75 - 81}{4} = -1.5\)
In golf a lower score is better, so the more negative standardised score is the better performance.
\(-1.5 < -1.25\), so Freya did better at Lakeside compared with the other players.

Explanation

Both standardised scores are negative because Freya took fewer shots than the mean on each course. In golf lower is better, so the better result is the one further below the mean in standard deviations - the more negative score. Her lower raw score at Hilltop and her bigger gap below the mean there are misleading because the Hilltop scores are more spread out.

Mark scheme
  1. 1 mark

    M1 for \(\dfrac{72 - 80}{6.4}\) or \(\dfrac{75 - 81}{4}\)

    oe

  2. 1 mark

    A1 for Hilltop: \(-1.25\) or Lakeside: \(-1.5\)

    oe, eg \(-1.3\) for Hilltop

  3. 1 mark

    A1 for \(-1.25\) and \(-1.5\) and Lakeside chosen, with a reason, eg her standardised score is lower (more negative) and a lower score is better

    oe. Both values must be in a comparable form. Choosing Hilltop because \(-1.25\) is greater scores M1A1A0. Choosing Hilltop because her score (72) was lower there, or because she was 8 shots below the mean there but only 6 at Lakeside, ignores the different standard deviations and scores 0 unless the standardised scores are seen. Accept 'she was further below the mean in standard deviations at Lakeside'. The question says 'You must show your working': a decision with no working scores 0.

Question 4

4 marks

The times taken by 240 runners to complete a 5 km fun run are normally distributed with a mean of 31 minutes and a standard deviation of 4 minutes.

Estimate the number of runners who took between 27 minutes and 39 minutes.

Model answer

27 minutes is \(31 - 4\) (1 standard deviation below the mean).
39 minutes is \(31 + 2 \times 4\) (2 standard deviations above the mean).
Between 27 and 31 minutes: \(68\% \div 2 = 34\%\)
Between 31 and 39 minutes: \(95\% \div 2 = 47.5\%\)
Total \(= 34\% + 47.5\% = 81.5\%\)
\(240 \times 0.815 = 195.6\), so about 196 runners.

Explanation

The interval is not symmetrical about the mean, so split it at the mean: half of 68% below and half of 95% above. Add the two parts, then multiply by the number of runners and round to a whole number. Using 68% or 95% on its own, or adding 68% and 95% without halving, are common errors.

Mark scheme
  1. 1 mark

    B1 for sight of 68% [\(66\dfrac{2}{3}\), 68.3] or 95% [95, 95.5], or 34% [\(33\dfrac{1}{3}\), 34.2] or 47.5% [47.5, 47.8]

    oe as decimals or fractions. M1 implies B1.

  2. 1 mark

    M1 for \(34 + 47.5\) or \((68 + 95) \div 2\) oe (= 81.5%)

    oe using their values in the ranges above, or the tails method \(100 - 16 - 2.5\) oe. Accept a proportion in [0.808, 0.82] for this mark.

  3. 1 mark

    M1dep for \(240 \times\) their 0.815

    oe, eg \(240 \times 0.815\) or \(\dfrac{81.5}{100} \times 240\). Their proportion must come from a method that adds a 1 standard deviation part and a 2 standard deviation part.

  4. 1 mark

    A1 for 196 (accept any whole number from 194 to 197)

    The answer must be a whole number of runners: 195.6 scores B1M1M1A0. Using 68% and 95% gives 195.6, so 195 or 196. Correct answer with no working scores full marks.

Ready to try the rest? Every answer you write is marked against the mark scheme, so you can see exactly where the marks are.

Study Helper Hints first, answers after you try

Stuck on this one? Ask for a hint and I’ll point you in the right direction, without giving the answer away. Once you’ve checked your answer, I’ll show you how the marks are awarded.