Level:
Correct: 0
Incorrect: 0
Marks: 0/0
Exam Practice
Course:
Topics:
AQA GCSE Statistics (Higher Paper 1) Smart practice A mixed round aimed at your weak spots
Unit 1
Planning and collecting data
Unit 2
Representing data
Section C: C1a (tabulation, tally, pictogram); Section E: E3d
Tabulation, tallies, pictograms and tables of data
Section C: C1a (pie chart), C1b (comparative pie chart)
Pie charts and comparative pie charts
Section C: C1a (stem and leaf diagram)
Stem and leaf diagrams
Section C: C2 (bar charts, bar line charts, line charts, frequency polygons)
Bar charts, line charts and frequency polygons
Section C: C2 (cumulative frequency charts)
Cumulative frequency diagrams
Section C: C2 (histograms), C3b
Histograms and frequency density
Section C: C2 (box plots); Section D: D3b; Section E: E5b
Box plots and outliers
Unit 3
Summarising data
Section D: D1a (mode, median, arithmetic mean)
Mode, median and mean
Section D: D1a (weighted mean, geometric mean), D1b
Weighted mean, geometric mean and choosing an average
Section D: D2; Section E: E5a
Skewness
Section D: D3a (range, quartiles, IQR, percentiles, interpercentile and interdecile range)
Range, quartiles, percentiles and interdecile range
Section D: D3a (standard deviation)
Standard deviation
Section C: C2 (time series); Section D: D1a (mean seasonal variation), D4; Section E: E6
Time series, moving averages and seasonal variation
Section C: C2 (scatter charts); Section D: D5
Scatter diagrams, lines of best fit and regression lines
Section D: D6; Section E: E9a, E9b, E9c
Spearman's rank correlation coefficient
Unit 4
Probability
Unit 5
Interpreting and evaluating results
Unit 6
Statistical enquiry cycle
3.6 Statistical enquiry cycle: 3.6.1 Initial planning, 3.6.2 Data collection
Statistical enquiry cycle: planning and data collection
3.6 Statistical enquiry cycle: 3.6.3 Processing and presentation, 3.6.4 Interpretation, 3.6.5 Evaluation
Statistical enquiry cycle: analysis and evaluation
Avg
score:
–
Topics
done:
0/39

Bar charts, line charts and frequency polygons

Practise 16 exam-style questions on Bar charts, line charts and frequency polygons for AQA GCSE Statistics (Higher Paper 1). Write your answer as you would in the exam and get it marked in seconds against the mark scheme, point by point, with the Study Helper on hand if you get stuck.

  • 16 questions
  • 1–5 marks each
  • Instant marking
  • No sign-up needed
16 questions, marked as you go

Sample questions with model answers

Here are 4 of the questions in this topic, each with a model answer, an explanation of why it earns the marks and the mark scheme an examiner would use.

Question 1

1 mark

The table shows the number of people in each of 50 cars that passed a school one morning.

Jamie wants to show these data in a diagram. He decides to use a bar line chart rather than a histogram.

Give a reason why a bar line chart is more suitable than a histogram for these data.
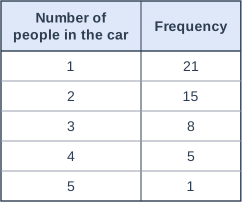
Table with columns "Number of people in the car", "Frequency". Number of people in the car: 1; Frequency: 21 | Number of people in the car: 2; Frequency: 15 | Number of people in the car: 3; Frequency: 8 | Number of people in the car: 4; Frequency: 5 | Number of people in the car: 5; Frequency: 1.

Model answer

The number of people in a car is discrete data (it can only be a whole number such as 1, 2 or 3), and a histogram is used for continuous data. A bar line chart shows each separate value as a single line.

Explanation

A bar line chart (vertical line chart) shows discrete data: each possible value has its own line, with gaps between the values. A histogram has touching bars because it shows continuous data, where every value within a class is possible. Answers such as 'it is clearer' do not give a statistical reason.

Mark scheme
  1. 1 mark

    B1 for the data are discrete / the number of people can only be a whole number

    oe, eg 'the data are not continuous', 'you cannot have 2.5 people in a car', 'histograms are for continuous data and these data are discrete'. Do not accept: 'the data are grouped' (they are not), 'the data are not grouped' on its own, 'the data are categorical / qualitative', 'it is easier to read' or 'it is clearer'. Ignore any non-contradictory or irrelevant statements.
Question 2

2 marks

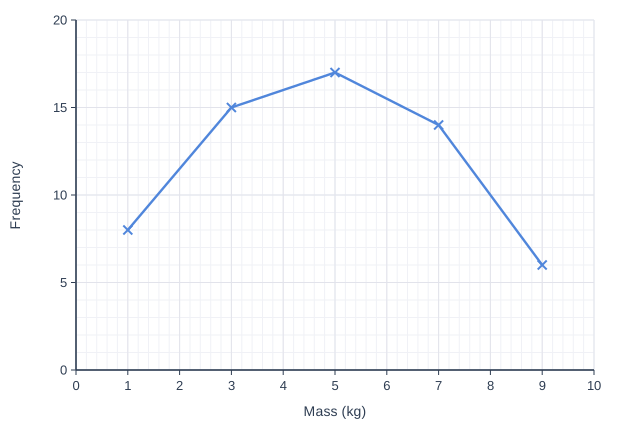
A courier weighed 60 parcels. The masses were grouped into classes of width 2 kg, from 0 kg to 10 kg.
The frequency polygon shows the results.

Work out the percentage of the parcels that had a mass of more than 6 kg.

Line graph of frequency (y-axis, 0 to 20) against mass (kg) (x-axis, 0 to 10). The line joins the points (1, 8), (3, 15), (5, 17), (7, 14), (9, 6).

Model answer

The points at 7 kg and 9 kg represent the classes from 6 kg to 8 kg and from 8 kg to 10 kg.
Number of parcels heavier than 6 kg = 14 + 6 = 20
\(\dfrac{20}{60} \times 100 = 33.3\%\)

Explanation

Each point of a frequency polygon is plotted at the midpoint of a class, so the point at 7 kg gives the frequency of the class from 6 kg to 8 kg. The parcels heavier than 6 kg are in the last two classes. A common error is to include the point at 5 kg, which represents parcels from 4 kg to 6 kg.

Mark scheme
  1. 1 mark

    M1 for \(\dfrac{14 + 6}{60}\) oe

    May be seen as 20/60. The point at 7 kg represents the class \(6 < m \le 8\) (frequency 14) and the point at 9 kg represents \(8 < m \le 10\) (frequency 6). Including the class \(4 < m \le 6\), eg (17 + 14 + 6)/60 = 61.7%, scores M0A0. Using only 14, eg 14/60 = 23.3%, scores M0A0.

  2. 1 mark

    A1 for 33.3

    oe, accept 33.3(...) or 33 1/3. Accept 33 with correct working seen. Correct answer with no working scores M1A1.

Question 3

3 marks

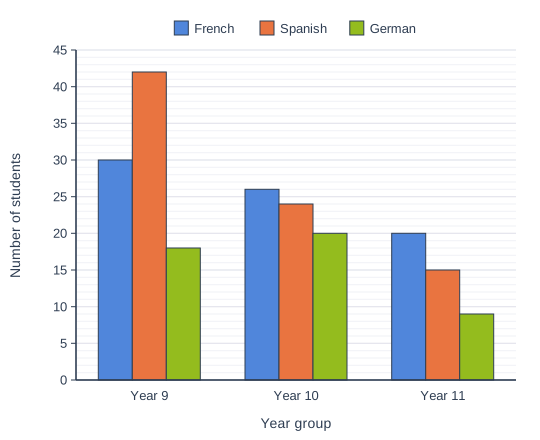
A school recorded which language each student in Years 9, 10 and 11 studies. Every student studies exactly one of French, Spanish or German.
The multiple bar chart shows the results.

Work out the percentage of all the students in these three year groups who study Spanish.
Give your answer to 1 decimal place.

Bar chart with three bars for each category of number of students for each year group, comparing French, Spanish and German (a key above the chart shows which bar is which). Year 9: French 30, Spanish 42, German 18; Year 10: French 26, Spanish 24, German 20; Year 11: French 20, Spanish 15, German 9.

Model answer

Spanish: 42 + 24 + 15 = 81
All students: Year 9 30 + 42 + 18 = 90, Year 10 26 + 24 + 20 = 70, Year 11 20 + 15 + 9 = 44, total 204
\(\dfrac{81}{204} \times 100 = 39.705...\)
Percentage = 39.7%

Explanation

Read every bar from the scale, add the Spanish bars, and divide by the total of all nine bars. Do not average the percentages for the three year groups: the year groups are different sizes, so this gives the wrong answer (38.3%).

Mark scheme
  1. 1 mark

    M1 for 42 + 24 + 15 (= 81)

    The total number of students who study Spanish.

  2. 1 mark

    M1 for 90 + 70 + 44 (= 204) or the sum of all nine bars

    Year 9: 30 + 42 + 18 = 90; Year 10: 26 + 24 + 20 = 70; Year 11: 20 + 15 + 9 = 44.

  3. 1 mark

    A1 for 39.7 [39.65, 39.75]

    From 81/204 × 100 = 39.705... Accept more accurate values, eg 39.71 or 39.706. Correct answer with no working scores M1M1A1. Averaging the three year-group percentages, (46.7 + 34.3 + 34.1)/3 = 38.3 or 38.4, is not a valid method (the year groups are different sizes): award only the M marks whose totals (81 or 204) are seen, and A0.

Question 4

4 marks

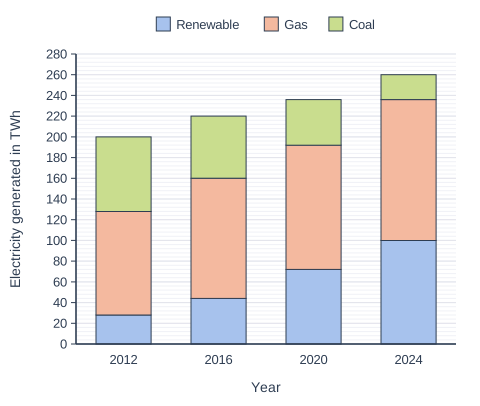
The composite bar chart shows the amount of electricity, in terawatt hours (TWh), generated in Country A from renewable sources, gas and coal in 2012, 2016, 2020 and 2024.

A newspaper says,
"The percentage of Country A's electricity that came from renewable sources more than tripled from 2012 to 2024."

Is the newspaper correct?
You must show your working.

Stacked bar chart with 4 vertical bars. The value axis (y-axis) is "Electricity generated in TWh", from 0 to 280 marked every 20; the bars are labelled along the x-axis, "Year", from left to right. Each bar is split into 3 parts, shown in the key: Renewable (bottom, blue), Gas (middle, orange) and Coal (top, green). Values: 2012: renewable 28 TWh, gas 100 TWh, coal 72 TWh; 2016: renewable 44 TWh, gas 116 TWh, coal 60 TWh; 2020: renewable 72 TWh, gas 120 TWh, coal 44 TWh; 2024: renewable 100 TWh, gas 136 TWh, coal 24 TWh. The values are not printed on the bars; they are read from the scale.

Model answer

2012: renewable = 28 TWh, total = 28 + 100 + 72 = 200 TWh, \(\dfrac{28}{200} \times 100 = 14\%\)
2024: renewable = 100 TWh, total = 100 + 136 + 24 = 260 TWh, \(\dfrac{100}{260} \times 100 = 38.5\%\)
Three times 14% is 42%, and 38.5% < 42%.
The newspaper is not correct: the percentage increased by a factor of about 2.75, not more than 3.

Explanation

The claim is about the percentage, so divide the renewable amount by the total for each year before comparing. The amount of renewable electricity did more than triple (28 to 100 TWh), but the total also grew, so the percentage did not. Read the renewable section from the bottom of each bar and the total from the top of the bar.

Mark scheme
  1. 1 mark

    M1 for \(\dfrac{28}{200}\) or \(\dfrac{100}{260}\) oe

    2012: renewable 28, total 200. 2024: renewable 100, total 260.

  2. 1 mark

    A1 for 14% and 38.5%

    oe, eg 0.14 and 0.385. Accept [38.4, 38.5] for 2024, or 5/13.

  3. 1 mark

    M1 for a valid comparison with three times their 2012 percentage, eg 3 × 14 = 42 or 38.5 ÷ 14 = 2.7(5)

    ft their two percentages. Comparing the amounts (28 TWh and 100 TWh, 100 ÷ 28 = 3.57) is not a comparison of percentages: M0 for this mark (and M0A0 for the first two marks unless the percentages are also found).

  4. 1 mark

    A1 for No, with 14% and 38.5% (or 42%) seen

    oe, eg 'No, 38.5% is less than 3 × 14% = 42%' or 'No, the percentage increased by a factor of only 2.75'. The question says 'You must show your working': a decision with no correct working scores 0. 'Yes' because the amount of renewable electricity more than tripled scores 0.

Ready to try the rest? Every answer you write is marked against the mark scheme, so you can see exactly where the marks are.

Study Helper Hints first, answers after you try

Stuck on this one? Ask for a hint and I’ll point you in the right direction, without giving the answer away. Once you’ve checked your answer, I’ll show you how the marks are awarded.