
Level:
Correct: 0
Incorrect: 0
Marks: 0/0
Exam Practice
Course:
Topics:
AQA GCSE Statistics (Higher Paper 2) Smart practice A mixed round aimed at your weak spots
Unit 1
Planning and collecting data
Unit 2
Representing data
Section C: C1a (tabulation, tally, pictogram); Section E: E3d
Tabulation, tallies, pictograms and tables of data
Section C: C1a (pie chart), C1b (comparative pie chart)
Pie charts and comparative pie charts
Section C: C1a (stem and leaf diagram)
Stem and leaf diagrams
Section C: C2 (bar charts, bar line charts, line charts, frequency polygons)
Bar charts, line charts and frequency polygons
Section C: C2 (cumulative frequency charts)
Cumulative frequency diagrams
Section C: C2 (histograms), C3b
Histograms and frequency density
Section C: C2 (box plots); Section D: D3b; Section E: E5b
Box plots and outliers
Unit 3
Summarising data
Section D: D1a (mode, median, arithmetic mean)
Mode, median and mean
Section D: D1a (weighted mean, geometric mean), D1b
Weighted mean, geometric mean and choosing an average
Section D: D2; Section E: E5a
Skewness
Section D: D3a (range, quartiles, IQR, percentiles, interpercentile and interdecile range)
Range, quartiles, percentiles and interdecile range
Section D: D3a (standard deviation)
Standard deviation
Section C: C2 (time series); Section D: D1a (mean seasonal variation), D4; Section E: E6
Time series, moving averages and seasonal variation
Section C: C2 (scatter charts); Section D: D5
Scatter diagrams, lines of best fit and regression lines
Section D: D6; Section E: E9a, E9b, E9c
Spearman's rank correlation coefficient
Unit 4
Probability
Unit 5
Interpreting and evaluating results
Unit 6
Statistical enquiry cycle
3.6 Statistical enquiry cycle: 3.6.1 Initial planning, 3.6.2 Data collection
Statistical enquiry cycle: planning and data collection
3.6 Statistical enquiry cycle: 3.6.3 Processing and presentation, 3.6.4 Interpretation, 3.6.5 Evaluation
Statistical enquiry cycle: analysis and evaluation
Avg
score:
–
Topics
done:
0/39

Time series, moving averages and seasonal variation

Practise 18 exam-style questions on Time series, moving averages and seasonal variation for AQA GCSE Statistics (Higher Paper 2). Write your answer as you would in the exam and get it marked in seconds against the mark scheme, point by point, with the Study Helper on hand if you get stuck.

  • 18 questions
  • 1–5 marks each
  • Instant marking
  • No sign-up needed
18 questions, marked as you go

Sample questions with model answers

Here are 4 of the questions in this topic, each with a model answer, an explanation of why it earns the marks and the mark scheme an examiner would use.

Question 1

1 mark

An online shop has data for the number of parcels it sent each quarter from 2021 Q1 to 2024 Q4.

The shop uses a trend line and the mean seasonal variation for Quarter 2 to make two predictions: the number of parcels it will send in 2025 Q2, and the number of parcels it will send in 2028 Q2.

Which of the two predictions is likely to be more reliable?
Give a reason for your answer.

Model answer

The prediction for 2025 Q2 is likely to be more reliable. It is only a year after the end of the data, so the trend and the seasonal pattern are less likely to have changed than they are by 2028.

Explanation

Every time series prediction assumes the trend and the seasonal pattern carry on in the same way. The further into the future the prediction is, the more chance there is that something changes, so predictions close to the end of the data are more reliable. Both predictions here are beyond the data, so 'extrapolation' does not tell them apart.

Mark scheme
  1. 1 mark

    B1 for 2025 Q2, because it is closer to the end of the data, so the trend (and the seasonal pattern) is less likely to have changed by then

    oe. The decision must be 2025 Q2 and a reason is needed. Accept 'it is less far into the future than 2028 Q2', 'the further ahead you predict, the more likely the trend is to change', 'it is only one year after the data end, but 2028 Q2 is four years after'. Do not accept: '2025 Q2' with no reason (B0); '2025 Q2 because it is not extrapolation' (B0: both predictions are beyond the data); '2028 Q2 because there will be more data by then' (B0). Ignore any non-contradictory or irrelevant statements.

Question 2

2 marks

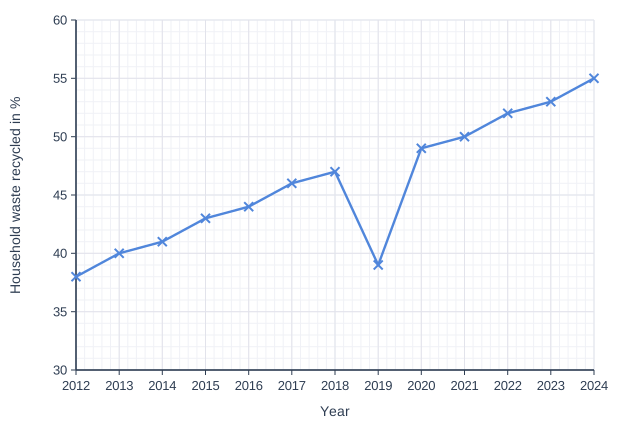
A council recorded the percentage of household waste that was recycled in its area each year from 2012 to 2024.
The graph shows the results.

Describe the trend in the percentage of household waste recycled.

One year does not fit the trend. Write down this year and suggest a possible reason for its value.

Line graph of household waste recycled in % (y-axis, 30 to 60) against year (x-axis, 2012 to 2024). The line joins the points (2012, 38), (2013, 40), (2014, 41), (2015, 43), (2016, 44), (2017, 46), (2018, 47), (2019, 39), (2020, 49), (2021, 50), (2022, 52), (2023, 53), (2024, 55).

Model answer

The percentage of household waste recycled increased steadily, from 38% in 2012 to 55% in 2024.

2019 does not fit the trend: only 39% was recycled, much lower than in 2018 and 2020. A possible reason is that the recycling collections were changed or disrupted that year (or the figure was recorded wrongly).

Explanation

The trend is the general direction over the whole period, so describe it in context using the start and the end of the data, not two neighbouring years. A value that does not fit the trend should be given a possible reason in context, such as a change or problem that year or a recording error; calling it an outlier does not explain it.

Mark scheme
  1. 1 mark

    B1 for the percentage of household waste recycled increased over the period (from 38% in 2012 to 55% in 2024)

    oe, eg 'the council is recycling a bigger percentage of its waste each year'. Must be in context (waste / recycling). 'Increasing' alone B0. 'Positive correlation' B0. A comment about only two consecutive years B0. Values are not needed, but any values stated must be correct (allow 1% either way).

  2. 1 mark

    B1 for 2019 with a possible reason, eg the recycling collections changed or were disrupted / the recycling centre was closed for part of the year / the data were recorded wrongly

    Both the year and a sensible reason are needed. Accept any sensible reason in context why a lower percentage was recycled that year, eg 'bins were collected less often', 'a strike by refuse collectors', 'a mistake in recording the data'. '2019' with no reason B0. '2019, because it is an outlier' B0 (no reason).

Question 3

3 marks

A magazine is published every two months, so there are six issues each year.
The table shows the number of copies sold of each issue in 2023 and 2024.

The publisher uses 6-point moving averages to look at the trend in sales.

Work out the first 6-point moving average.
Write down the two issues that it should be plotted between on a time series graph.

Without working it out, explain how you know that the second 6-point moving average is less than the first.

Table with columns "Year", "Jan-Feb", "Mar-Apr", "May-Jun", "Jul-Aug", "Sep-Oct", "Nov-Dec". Year: 2023; Jan-Feb: 4210; Mar-Apr: 4050; May-Jun: 3980; Jul-Aug: 3620; Sep-Oct: 4140; Nov-Dec: 5140 | Year: 2024; Jan-Feb: 4150; Mar-Apr: 3990; May-Jun: 3910; Jul-Aug: 3560; Sep-Oct: 4080; Nov-Dec: 5090.

Model answer

First 6-point moving average \(= \dfrac{4210 + 4050 + 3980 + 3620 + 4140 + 5140}{6} = \dfrac{25140}{6} = 4190\) copies

It uses the six issues of 2023, so it is plotted at the middle of them: halfway between the May-Jun 2023 issue (the 3rd) and the Jul-Aug 2023 issue (the 4th).

The second 6-point moving average uses the same five issues as the first, except that Jan-Feb 2023 (4210) is replaced by Jan-Feb 2024 (4150). 4150 is smaller than 4210, so the total of the six values is smaller and the second moving average is less than the first.

Explanation

A 6-point moving average is the mean of six consecutive values, and with an even number of points it is plotted halfway between the two middle time points. Consecutive 6-point moving averages share five values, so the second differs from the first only because the oldest value is replaced by the newest. As 4150 < 4210, the moving average falls, by (4210 - 4150) ÷ 6 = 10.

Mark scheme
  1. 1 mark

    B1 for 4190 (copies)

    \((4210 + 4050 + 3980 + 3620 + 4140 + 5140) \div 6 = 25140 \div 6\). Correct answer with no working scores the mark. 3965 (a 4-point moving average of the first four issues) scores B0.

  2. 1 mark

    B1 for between the May-Jun 2023 issue and the Jul-Aug 2023 issue

    oe, eg 'halfway between the 3rd and 4th issues', 'at issue 3.5'. Independent of the first mark. The first moving average uses the six issues of 2023, and an even-point moving average is plotted at the middle of its time points, halfway between the 3rd and the 4th. Plotting it at Nov-Dec 2023 (the last of the six) or at a single issue scores B0.

  3. 1 mark

    B1 for the second moving average leaves out Jan-Feb 2023 (4210) and includes Jan-Feb 2024 (4150), which is smaller, so the total and the moving average are smaller

    oe. Must refer to the first value (4210) being replaced by the seventh value (4150), and that the new value is smaller. 'Sales are going down' B0 (no reference to the values that change). Working out the second moving average (4180) with no explanation B0, because the question asks for an explanation without working it out; a calculation as well as a correct explanation scores B1.

Question 4

4 marks

A company services gas boilers. It numbers the quarters \(t = 1\) for 2022 Q1, \(t = 2\) for 2022 Q2, and so on.
The equation of the trend line for the number of boilers it services each quarter is

\(y = 640 + 12t\)

The table shows the mean seasonal variation for each quarter.

Work out the first quarter in which the predicted number of boiler services is more than 1000.
Give the year and the quarter.

Table with columns "Quarter", "Q1", "Q2", "Q3", "Q4". Quarter: Mean seasonal variation; Q1: +40; Q2: −85; Q3: −50; Q4: +95.

Model answer

Quarter 4: \(640 + 12t + 95 > 1000\), so \(12t > 265\) and \(t > 22.08\)
The Quarter 4 values of t are 4, 8, 12, 16, 20, 24, ..., so the first is t = 24 (2027 Q4): \(640 + 12 \times 24 + 95 = 1023\)
(2026 Q4, t = 20, gives \(640 + 240 + 95 = 975\).)

Quarter 1 is the only other quarter with a positive seasonal variation: \(640 + 12t + 40 > 1000\) needs \(t > 26.7\), so the first is 2029 Q1, which is later. (2027 Q1, t = 21, gives 932.)

Quarters 2 and 3 have negative seasonal variations, so they are lower still.

The first quarter is 2027 Q4.

Explanation

Each prediction is the trend value plus that quarter's mean seasonal variation, so each quarter reaches 1000 at a different time. The rising trend gets there soonest in the quarter with the largest seasonal variation, Quarter 4, but the t value must be one that belongs to Quarter 4 (a multiple of 4). Ignoring the seasonal variations, or rounding t = 22.08 up to 23 (a Quarter 3), are common errors.

Mark scheme
  1. 1 mark

    M1 for a correct prediction for any quarter: \(640 + 12t\) plus the mean seasonal variation for that quarter, eg 2026 Q4: \(640 + 12 \times 20 + 95\) (= 975)

    oe. The value of t must match the quarter, eg 2026 Q4 is t = 20 and 2027 Q4 is t = 24.

  2. 1 mark

    M1 for \(640 + 12t + 95 > 1000\) giving \(t > 22.08\), or \(640 + 12 \times 24 + 95\) (= 1023)

    oe, eg the equation \(640 + 12t + 95 = 1000\). Trying Quarter 4 values of t is acceptable.

  3. 1 mark

    M1 for showing that no Quarter 1 before 2027 Q4 gives more than 1000, eg 2027 Q1: \(640 + 12 \times 21 + 40\) (= 932), or \(640 + 12t + 40 > 1000\) giving \(t > 26.7\)

    Quarter 1 is the only other quarter with a positive mean seasonal variation; Quarters 2 and 3 have negative ones and do not reach 1000 before 2027 Q4. A correct table of predictions for each quarter from 2026 Q1 to 2027 Q4 earns all three M marks.

  4. 1 mark

    A1 for 2027 Q4

    Needs at least the second M1. Correct answer with no working scores 4 marks. Common wrong answers: 2027 Q3 (t = 23 from \(t > 22.08\) without matching the quarter) scores M1M1M0A0; 2029 Q3 (ignoring the seasonal variations: \(640 + 12t > 1000\)) scores M0M0M0A0.

Ready to try the rest? Every answer you write is marked against the mark scheme, so you can see exactly where the marks are.

Study Helper Hints first, answers after you try

Stuck on this one? Ask for a hint and I’ll point you in the right direction, without giving the answer away. Once you’ve checked your answer, I’ll show you how the marks are awarded.
