
Level:
Correct: 0
Incorrect: 0
Marks: 0/0
Exam Practice
Course:
Topics:
AQA GCSE Statistics (Higher Paper 2) Smart practice A mixed round aimed at your weak spots
Unit 1
Planning and collecting data
Unit 2
Representing data
Section C: C1a (tabulation, tally, pictogram); Section E: E3d
Tabulation, tallies, pictograms and tables of data
Section C: C1a (pie chart), C1b (comparative pie chart)
Pie charts and comparative pie charts
Section C: C1a (stem and leaf diagram)
Stem and leaf diagrams
Section C: C2 (bar charts, bar line charts, line charts, frequency polygons)
Bar charts, line charts and frequency polygons
Section C: C2 (cumulative frequency charts)
Cumulative frequency diagrams
Section C: C2 (histograms), C3b
Histograms and frequency density
Section C: C2 (box plots); Section D: D3b; Section E: E5b
Box plots and outliers
Unit 3
Summarising data
Section D: D1a (mode, median, arithmetic mean)
Mode, median and mean
Section D: D1a (weighted mean, geometric mean), D1b
Weighted mean, geometric mean and choosing an average
Section D: D2; Section E: E5a
Skewness
Section D: D3a (range, quartiles, IQR, percentiles, interpercentile and interdecile range)
Range, quartiles, percentiles and interdecile range
Section D: D3a (standard deviation)
Standard deviation
Section C: C2 (time series); Section D: D1a (mean seasonal variation), D4; Section E: E6
Time series, moving averages and seasonal variation
Section C: C2 (scatter charts); Section D: D5
Scatter diagrams, lines of best fit and regression lines
Section D: D6; Section E: E9a, E9b, E9c
Spearman's rank correlation coefficient
Unit 4
Probability
Unit 5
Interpreting and evaluating results
Unit 6
Statistical enquiry cycle
3.6 Statistical enquiry cycle: 3.6.1 Initial planning, 3.6.2 Data collection
Statistical enquiry cycle: planning and data collection
3.6 Statistical enquiry cycle: 3.6.3 Processing and presentation, 3.6.4 Interpretation, 3.6.5 Evaluation
Statistical enquiry cycle: analysis and evaluation
Avg
score:
–
Topics
done:
0/39

Spearman's rank correlation coefficient

Practise 16 exam-style questions on Spearman's rank correlation coefficient for AQA GCSE Statistics (Higher Paper 2). Write your answer as you would in the exam and get it marked in seconds against the mark scheme, point by point, with the Study Helper on hand if you get stuck.

  • 16 questions
  • 1–6 marks each
  • Instant marking
  • No sign-up needed
16 questions, marked as you go

Sample questions with model answers

Here are 4 of the questions in this topic, each with a model answer, an explanation of why it earns the marks and the mark scheme an examiner would use.

Question 1

1 mark

Kai calculated Spearman's rank correlation coefficient for two sets of data. He got the value 1.2

Explain how you know that Kai has made a mistake.

Model answer

Spearman's rank correlation coefficient always lies between -1 and +1. Kai's value, 1.2, is greater than 1, so he must have made a mistake.

Explanation

In the formula, 6Σd² ÷ n(n² - 1) can never be negative, because Σd² is a sum of squares, so r_s can never be more than 1. The value 1 means the two rankings are exactly the same and -1 means they are exactly opposite. A value outside -1 to 1 is a sign of an arithmetic error, such as a wrong Σd².

Mark scheme
  1. 1 mark

    B1 for Spearman's rank correlation coefficient must be between -1 and 1 (it cannot be more than 1)

    oe, eg 'the largest possible value is 1'. 'It should be negative' B0. 'It is too big' with no reference to 1 B0. 'Correlation coefficients cannot be decimals' B0.
Question 2

2 marks

Leo recorded the age and the price of 9 used cars of the same model. No two cars had the same age or the same price.

To calculate Spearman's rank correlation coefficient, he gave rank 1 to the oldest car and rank 1 to the cheapest car. He got \(r_s = 0.86\)

Leo says,
"This shows that older cars tend to cost more."

Explain Leo's mistake.

Write down the correct value of \(r_s\) for the age and the price of the cars.

Model answer

Leo ranked age from the highest value (oldest = 1) but price from the lowest value (cheapest = 1). Both variables must be ranked in the same direction. Because one ranking is the wrong way round, the sign of his answer is reversed.

The correct value is \(r_s = -0.86\): older cars tend to cost less, not more.

Explanation

When the rankings are in opposite directions, every rank of one variable is reversed, which changes the sign of r_s but not its size (when there are no ties). Rank both variables from the highest value, or both from the lowest, so that a positive value means 'higher with higher'. Here the correct value shows negative correlation between age and price.

Mark scheme
  1. 1 mark

    B1 for he ranked the two variables in opposite directions (age from the highest value, price from the lowest), so the sign of his coefficient is the wrong way round

    oe, eg 'he should rank both from the oldest/most expensive (or both from the youngest/cheapest)', 'rank 1 should be the highest value for both variables'. Accept 'older cars actually tend to cost less, because he ranked one variable the wrong way round'. 'He ranked them wrong' with no detail B0.

  2. 1 mark

    B1 for -0.86

    Independent of the first mark. With no ties, reversing the ranks of one variable changes the sign of \(r_s\) but not its size. 0.86 or 0.14 B0.

Question 3

3 marks

A council ranked a group of its parks by area and by the number of visitors in one week. There were no ties.

For these rankings, \(\sum d^2 = 30\) and Spearman's rank correlation coefficient is 0.75

Use \(r_s = 1 - \dfrac{6\sum d^2}{n(n^2 - 1)}\) to work out the number of parks in the group.

Model answer

\(1 - \dfrac{6 \times 30}{n(n^2 - 1)} = 0.75\)

\(\dfrac{180}{n(n^2 - 1)} = 0.25\)

\(n(n^2 - 1) = 180 \div 0.25 = 720\)

Trying values: \(8 \times 63 = 504\), \(9 \times 80 = 720\)

So \(n = 9\): there are 9 parks in the group.

Explanation

Substitute the known values into the formula and rearrange to find n(n² - 1). It is quickest to try whole numbers for n: 9 × (81 - 1) = 720. A useful check is to put n = 9 back into the formula: 1 - 180 ÷ 720 = 0.75.

Mark scheme
  1. 1 mark

    M1 for \(1 - \dfrac{6 \times 30}{n(n^2 - 1)} = 0.75\)

    oe, eg \(\dfrac{180}{n(n^2 - 1)} = 0.25\). A trial of a value of n in the formula, eg \(1 - \dfrac{180}{8 \times 63} = 0.643\), also scores M1.

  2. 1 mark

    M1dep for \(n(n^2 - 1) = 720\)

    oe, eg \(180 \div 0.25\), or trials of at least two values of n either side of the answer

  3. 1 mark

    A1 for 9 (parks)

    Check: \(9 \times 80 = 720\). Trial and improvement is acceptable (see the first two marks). Correct answer with no working scores 3 marks. Using 1 - 0.75 = 0.25 wrongly, eg \(180 \div 0.75 = 240\), leads to no whole number n: M1M0A0.

Question 4

5 marks

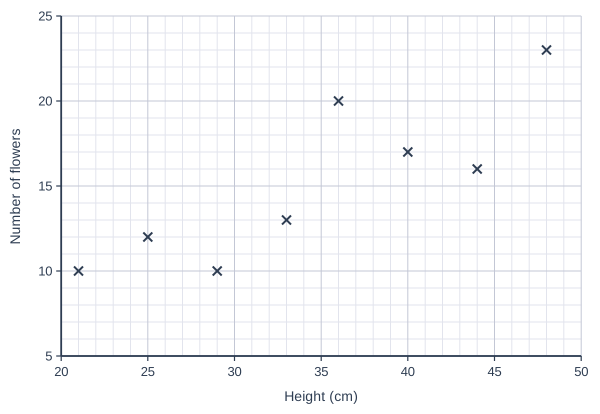
A garden centre measured the height, in cm, of each of 8 plants of the same type and counted the number of flowers on each plant.
The scatter graph shows the results.

Use \(r_s = 1 - \dfrac{6\sum d^2}{n(n^2 - 1)}\) to calculate Spearman's rank correlation coefficient between the height and the number of flowers.
Give your answer to 2 decimal places.

Scatter graph on a grid of small squares. The horizontal axis is "Height (cm)", from 20 to 50, numbered every 5, with 5 small squares between numbered values (each small square is 1). The vertical axis is "Number of flowers", from 5 to 25, numbered every 5, with 5 small squares between numbered values (each small square is 1). 8 points are plotted as crosses: (21, 10), (25, 12), (29, 10), (33, 13), (36, 20), (40, 17), (44, 16) and (48, 23).

Model answer

Reading the points from the graph and ranking from the largest value (rank 1):

Height (cm): 21, 25, 29, 33, 36, 40, 44, 48 → ranks 8, 7, 6, 5, 4, 3, 2, 1
Flowers: 10, 12, 10, 13, 20, 17, 16, 23 → ranks 7.5, 6, 7.5, 5, 2, 3, 4, 1
(the two plants with 10 flowers share ranks 7 and 8, so each gets 7.5)

Differences, \(d\): 0.5, 1, -1.5, 0, 2, 0, -2, 0

\(\sum d^2 = 0.25 + 1 + 2.25 + 0 + 4 + 0 + 4 + 0 = 11.5\)

\(r_s = 1 - \dfrac{6 \times 11.5}{8(8^2 - 1)} = 1 - \dfrac{69}{504} = 0.8630...\)

\(r_s = 0.86\) (to 2 decimal places)

Explanation

Read each point's coordinates carefully, keeping each plant's height and number of flowers together, and look out for points at the same height on the graph: two plants have 10 flowers, so they share ranks 7 and 8 and each gets the mean rank, 7.5. Rank each variable in the same direction, then find the difference in ranks for each plant. The value 0.86 shows strong positive correlation: taller plants tend to have more flowers.

Mark scheme
  1. 2 marks

    B2 for correct ranks for both variables, eg (tallest = rank 1): heights 21, 25, 29, 33, 36, 40, 44, 48 cm have ranks 8, 7, 6, 5, 4, 3, 2, 1, and the numbers of flowers 10, 12, 10, 13, 20, 17, 16, 23 on these plants have ranks 7.5, 6, 7.5, 5, 2, 3, 4, 1

    Or both ranked from the smallest value (rank 1 = shortest and fewest flowers): heights 1 to 8 and flowers 1.5, 3, 1.5, 4, 7, 6, 5, 8. B1 for one variable ranked correctly. The plants of height 21 cm and 29 cm both have 10 flowers, so they share ranks 7 and 8 and each is given 7.5 (or 1.5 when ranking from the smallest). The two variables must be ranked in the same direction for B2. The data are read from the graph: (21, 10), (25, 12), (29, 10), (33, 13), (36, 20), (40, 17), (44, 16), (48, 23).

  2. 1 mark

    M1 for a correct method for \(\sum d^2\) (= 11.5)

    Allow one error. 11.5 is an exact value. The differences are 0.5, 1, -1.5, 0, 2, 0, -2, 0 (or the negatives of these) and the squared differences are 0.25, 1, 2.25, 0, 4, 0, 4, 0. ft their ranks, eg giving both tied plants rank 7 (\(\sum d^2 = 11\)) or rank 8 (\(\sum d^2 = 13\)).

  3. 1 mark

    M1dep for \(1 - \dfrac{6 \times 11.5}{8(8^2 - 1)}\)

    oe, eg \(1 - \dfrac{69}{504}\). ft their \(\sum d^2\). If '1 -' is seen it must be in the correct place.

  4. 1 mark

    A1 for 0.86

    Accept [0.862, 0.864], eg 0.863; a calculator working out the PMCC of the ranks gives 0.862, which is also accepted. Correct answer with no working scores 5 marks (a calculator can do the work, and the correct ranks are needed to get it). Common wrong answers: 0.87 (both tied plants given rank 7), 0.85 (both given rank 8), 0.83 or 0.88 (tied plants given ranks 7 and 8): B1M1M1A0; -0.86 (ranking the variables in opposite directions): B1M1M1A0; 0.14 (forgetting to subtract from 1): B2M1M0A0.

Ready to try the rest? Every answer you write is marked against the mark scheme, so you can see exactly where the marks are.

Study Helper Hints first, answers after you try

Stuck on this one? Ask for a hint and I’ll point you in the right direction, without giving the answer away. Once you’ve checked your answer, I’ll show you how the marks are awarded.