
Level:
Correct: 0
Incorrect: 0
Marks: 0/0
Exam Practice
Course:
Topics:
AQA GCSE Statistics (Higher Paper 2) Smart practice A mixed round aimed at your weak spots
Unit 1
Planning and collecting data
Unit 2
Representing data
Section C: C1a (tabulation, tally, pictogram); Section E: E3d
Tabulation, tallies, pictograms and tables of data
Section C: C1a (pie chart), C1b (comparative pie chart)
Pie charts and comparative pie charts
Section C: C1a (stem and leaf diagram)
Stem and leaf diagrams
Section C: C2 (bar charts, bar line charts, line charts, frequency polygons)
Bar charts, line charts and frequency polygons
Section C: C2 (cumulative frequency charts)
Cumulative frequency diagrams
Section C: C2 (histograms), C3b
Histograms and frequency density
Section C: C2 (box plots); Section D: D3b; Section E: E5b
Box plots and outliers
Unit 3
Summarising data
Section D: D1a (mode, median, arithmetic mean)
Mode, median and mean
Section D: D1a (weighted mean, geometric mean), D1b
Weighted mean, geometric mean and choosing an average
Section D: D2; Section E: E5a
Skewness
Section D: D3a (range, quartiles, IQR, percentiles, interpercentile and interdecile range)
Range, quartiles, percentiles and interdecile range
Section D: D3a (standard deviation)
Standard deviation
Section C: C2 (time series); Section D: D1a (mean seasonal variation), D4; Section E: E6
Time series, moving averages and seasonal variation
Section C: C2 (scatter charts); Section D: D5
Scatter diagrams, lines of best fit and regression lines
Section D: D6; Section E: E9a, E9b, E9c
Spearman's rank correlation coefficient
Unit 4
Probability
Unit 5
Interpreting and evaluating results
Unit 6
Statistical enquiry cycle
3.6 Statistical enquiry cycle: 3.6.1 Initial planning, 3.6.2 Data collection
Statistical enquiry cycle: planning and data collection
3.6 Statistical enquiry cycle: 3.6.3 Processing and presentation, 3.6.4 Interpretation, 3.6.5 Evaluation
Statistical enquiry cycle: analysis and evaluation
Avg
score:
–
Topics
done:
0/39

Rates of change, including birth and death rates

Practise 14 exam-style questions on Rates of change, including birth and death rates for AQA GCSE Statistics (Higher Paper 2). Write your answer as you would in the exam and get it marked in seconds against the mark scheme, point by point, with the Study Helper on hand if you get stuck.

  • 14 questions
  • 1–5 marks each
  • Instant marking
  • No sign-up needed
14 questions, marked as you go

Sample questions with model answers

Here are 4 of the questions in this topic, each with a model answer, an explanation of why it earns the marks and the mark scheme an examiner would use.

Question 1

1 mark

The unemployment rate in a region fell from 5% in 2023 to 4% in 2024.

By what percentage did the unemployment rate decrease?

Choose your answer.

  • 1%
  • 4%
  • 20%
  • 25%

Model answer

20%
Decrease = 5 - 4 = 1 percentage point
Percentage decrease \(= \dfrac{1}{5} \times 100 = 20\)%

Explanation

When a rate that is already a percentage changes, the change in the rate (1 percentage point) is not the same as the percentage change. The percentage decrease compares the fall with the original value: 1 out of 5 is 20%. Dividing by the new value, 4, gives 25%, which is wrong.

Mark scheme
  1. 1 mark

    B1 for 20%

    Any other answer, or more than one answer, scores B0. The rate fell by 1 percentage point, which is \(\dfrac{1}{5} \times 100 = 20\)% of its 2023 value. 1% confuses the fall in percentage points with the percentage decrease; 25% divides by the 2024 value instead of the 2023 value; 4% is the 2024 rate. (This item is marked by sound statistical practice.)
Question 2

2 marks

\(\text{general fertility rate} = \dfrac{\text{number of births}}{\text{number of women aged 15 to 44}} \times 1000\)

In 2024, a town had a general fertility rate of 58.0 and there were 1218 births.

Work out the number of women aged 15 to 44 in the town in 2024.

Model answer

\(58 = \dfrac{1218}{w} \times 1000\), where w is the number of women aged 15 to 44
\(w = \dfrac{1218 \times 1000}{58} = 21\,000\) women

Explanation

Rearrange the formula: the number of women = number of births × 1000 ÷ general fertility rate. A rate of 58.0 means 58 births for every 1000 women aged 15 to 44, so 1218 births means 1218 ÷ 58 = 21 thousand women. Multiplying the rate by the births instead of dividing is a common error.

Mark scheme
  1. 1 mark

    M1 for \(\dfrac{1218 \times 1000}{58}\) or \(\dfrac{1218}{58}\) × 1000

    oe, eg \(58 = \dfrac{1218}{w} \times 1000\) rearranged correctly

  2. 1 mark

    A1 for 21 000

    Correct answer with no working scores 2 marks. \(\dfrac{58 \times 1218}{1000}\) = 70.6 scores M0A0. 2100 (using 100 instead of 1000) scores M0A0.

Question 3

3 marks

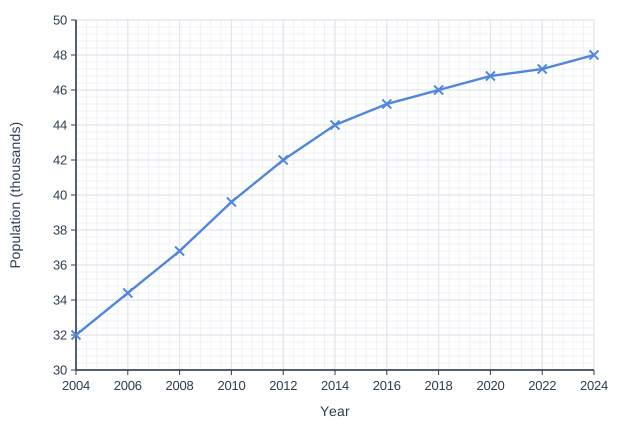
The graph shows the population of a town from 2004 to 2024.

Work out the average rate of increase of the population, in people per year, from 2004 to 2014 and from 2014 to 2024.
Comment on how the rate of increase changed.

Line graph of population (thousands) (y-axis, 30 to 50) against year (x-axis, 2004 to 2024). The line joins the points (2004, 32), (2006, 34.4), (2008, 36.8), (2010, 39.6), (2012, 42), (2014, 44), (2016, 45.2), (2018, 46), (2020, 46.8), (2022, 47.2), (2024, 48).

Model answer

From the graph: 32 000 people in 2004, 44 000 in 2014 and 48 000 in 2024.
2004 to 2014: \(\dfrac{44\,000 - 32\,000}{10} = 1200\) people per year
2014 to 2024: \(\dfrac{48\,000 - 44\,000}{10} = 400\) people per year
The population kept increasing, but it grew much more slowly from 2014 to 2024: the average rate of increase fell from 1200 to 400 people per year.

Explanation

An average rate of change is the change in the value divided by the time taken (10 years for each period). On a graph it is the steepness of the line: the line is less steep after 2014. The population was still rising, so the correct comment is that growth slowed, not that the population fell.

Mark scheme
  1. 1 mark

    M1 for a correct method for one average rate, eg \(\dfrac{44\,000 - 32\,000}{10}\) or \(\dfrac{48\,000 - 44\,000}{10}\)

    oe. Values read from the graph: 32 000 (2004), 44 000 (2014), 48 000 (2024); allow readings within ±200 people. Working in thousands, eg 12 ÷ 10 = 1.2 (thousand), is acceptable.

  2. 1 mark

    A1 for 1200 (people per year) [1160, 1240] and 400 (people per year) [360, 440]

    Both values needed. Accept 1.2 thousand and 0.4 thousand. Dividing by 11 (counting the years 2004 to 2014 inclusive) A0.

  3. 1 mark

    B1ft for the population grew more slowly from 2014 to 2024 than from 2004 to 2014 / the rate of increase fell (to about a third)

    oe. ft their two rates. Must refer to the rate (speed) of growth, not only that the population increased. 'The population went up' B0. 'The population fell after 2014' B0. Ignore any non-contradictory or irrelevant statements.

Question 4

4 marks

At the start of 2024, Town A had a population of 60 000 and Town B had a population of 60 400.

During 2024:
Town A had a birth rate of 13.2 and a death rate of 8.6
Town B had a birth rate of 10.0 and a death rate of 12.5
Nobody moved into or out of either town.

\(\text{birth rate} = \dfrac{\text{number of births}}{\text{total population}} \times 1000\)   \(\text{death rate} = \dfrac{\text{number of deaths}}{\text{total population}} \times 1000\)

Use the population at the start of 2024 as the total population.

Show that, at the end of 2024, Town A had a larger population than Town B.

Model answer

Town A: births \(= \dfrac{13.2 \times 60\,000}{1000} = 792\), deaths \(= \dfrac{8.6 \times 60\,000}{1000} = 516\)
Population at the end of 2024 = 60 000 + 792 - 516 = 60 276
Town B: births \(= \dfrac{10.0 \times 60\,400}{1000} = 604\), deaths \(= \dfrac{12.5 \times 60\,400}{1000} = 755\)
Population at the end of 2024 = 60 400 + 604 - 755 = 60 249
60 276 > 60 249, so at the end of 2024 Town A had a larger population than Town B.

Explanation

Turn each rate into a number of people: rate × population ÷ 1000. Town A had more births than deaths, so it grew; Town B had more deaths than births, so it shrank, and that was enough for Town A to overtake it. In a 'show that' question every step, including both final populations, must be written down.

Mark scheme
  1. 1 mark

    M1 for one of: births in A = 792, deaths in A = 516, births in B = 604, deaths in B = 755

    oe, eg \(\dfrac{13.2 \times 60\,000}{1000}\) = 792

  2. 1 mark

    M1 for the change in the population of either town: +276 for Town A or -151 for Town B

    oe, eg 792 - 516, or \(\dfrac{(13.2 - 8.6) \times 60\,000}{1000}\), or \(\dfrac{(10.0 - 12.5) \times 60\,400}{1000}\)

  3. 1 mark

    M1dep for both populations at the end of 2024: 60 000 + 276 and 60 400 - 151

    oe. Both changes must be applied with the correct signs.

  4. 1 mark

    A1 for 60 276 (Town A) and 60 249 (Town B), with a conclusion that Town A's population is larger

    This is a 'show that' question: both final populations and the conclusion must be seen. Equivalent: Town A gains 276 and Town B loses 151, so the gap of 400 changes by 427 and Town A ends 27 people ahead, with the conclusion. A conclusion without working scores 0.

Ready to try the rest? Every answer you write is marked against the mark scheme, so you can see exactly where the marks are.

Study Helper Hints first, answers after you try

Stuck on this one? Ask for a hint and I’ll point you in the right direction, without giving the answer away. Once you’ve checked your answer, I’ll show you how the marks are awarded.