
Level:
Correct: 0
Incorrect: 0
Marks: 0/0
Exam Practice
Course:
Topics:
AQA GCSE Statistics (Higher Paper 2) Smart practice A mixed round aimed at your weak spots
Unit 1
Planning and collecting data
Unit 2
Representing data
Section C: C1a (tabulation, tally, pictogram); Section E: E3d
Tabulation, tallies, pictograms and tables of data
Section C: C1a (pie chart), C1b (comparative pie chart)
Pie charts and comparative pie charts
Section C: C1a (stem and leaf diagram)
Stem and leaf diagrams
Section C: C2 (bar charts, bar line charts, line charts, frequency polygons)
Bar charts, line charts and frequency polygons
Section C: C2 (cumulative frequency charts)
Cumulative frequency diagrams
Section C: C2 (histograms), C3b
Histograms and frequency density
Section C: C2 (box plots); Section D: D3b; Section E: E5b
Box plots and outliers
Unit 3
Summarising data
Section D: D1a (mode, median, arithmetic mean)
Mode, median and mean
Section D: D1a (weighted mean, geometric mean), D1b
Weighted mean, geometric mean and choosing an average
Section D: D2; Section E: E5a
Skewness
Section D: D3a (range, quartiles, IQR, percentiles, interpercentile and interdecile range)
Range, quartiles, percentiles and interdecile range
Section D: D3a (standard deviation)
Standard deviation
Section C: C2 (time series); Section D: D1a (mean seasonal variation), D4; Section E: E6
Time series, moving averages and seasonal variation
Section C: C2 (scatter charts); Section D: D5
Scatter diagrams, lines of best fit and regression lines
Section D: D6; Section E: E9a, E9b, E9c
Spearman's rank correlation coefficient
Unit 4
Probability
Unit 5
Interpreting and evaluating results
Unit 6
Statistical enquiry cycle
3.6 Statistical enquiry cycle: 3.6.1 Initial planning, 3.6.2 Data collection
Statistical enquiry cycle: planning and data collection
3.6 Statistical enquiry cycle: 3.6.3 Processing and presentation, 3.6.4 Interpretation, 3.6.5 Evaluation
Statistical enquiry cycle: analysis and evaluation
Avg
score:
–
Topics
done:
0/39

Probability from data, expected frequency and risk

Practise 15 exam-style questions on Probability from data, expected frequency and risk for AQA GCSE Statistics (Higher Paper 2). Write your answer as you would in the exam and get it marked in seconds against the mark scheme, point by point, with the Study Helper on hand if you get stuck.

  • 15 questions
  • 1–5 marks each
  • Instant marking
  • No sign-up needed
15 questions, marked as you go

Sample questions with model answers

Here are 4 of the questions in this topic, each with a model answer, an explanation of why it earns the marks and the mark scheme an examiner would use.

Question 1

1 mark

Here are four statements from a report about injuries in a rugby league.

A   Players who do not warm up are 3 times as likely to be injured as players who do.
B   About 4 in every 100 players in the league are injured each season.
C   Wearing a gum shield halves the risk of a mouth injury.
D   The risk of an injury is 25% higher in wet weather than in dry weather.

Which statement gives an absolute risk?

Choose your answer.

  • A
  • B
  • C
  • D

Model answer

B
It gives the actual chance of a player being injured in a season (4 in 100). The other three statements compare the risk in one group with the risk in another group, so they are relative risks.

Explanation

An absolute risk is the probability that something happens to a member of one group, such as 4 in 100. A relative risk compares two groups: '3 times as likely', 'halves the risk' and '25% higher' are all relative risks, and none of them tells you how likely an injury actually is.

Mark scheme
  1. 1 mark

    B1 for B

    Accept the statement written out instead of the letter. B gives the actual chance of an injury in one group (4 in 100, or 4%), which is an absolute risk. A, C and D each compare the risks for two groups, so they are relative risks (3, 0.5 and 1.25). Any other answer, or more than one answer, scores B0.
Question 2

2 marks

A delivery company's records show that 18 of the 7200 parcels it delivered last month were damaged.

Write the risk that a parcel is damaged in the form '1 in n', where n is a whole number.
Then write this risk as a percentage.

Model answer

\(7200 \div 18 = 400\), so the risk is 1 in 400.
\(\dfrac{1}{400} = 0.0025\), and \(0.0025 \times 100 = 0.25\%\)

Explanation

The absolute risk is 18 damaged parcels out of 7200, so 1 parcel in every \(7200 \div 18 = 400\). As a percentage it is \(\dfrac{1}{400} \times 100 = 0.25\%\). Writing a small risk as '1 in n' or as a percentage makes it easier to understand and compare.

Mark scheme
  1. 1 mark

    B1 for 1 in 400

    Accept n = 400. \(7200 \div 18 = 400\). '18 in 7200' (not simplified) scores B0.

  2. 1 mark

    B1 for 0.25%

    \(\dfrac{18}{7200} \times 100 = 0.25\%\). The % sign must be seen. 0.0025% or 2.5% scores B0. 0.0025 (the decimal, with no % sign) scores B0.

Question 3

3 marks

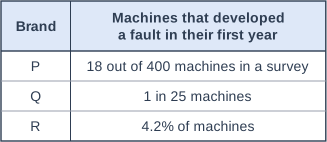
A consumer magazine collected information about whether new washing machines of three brands, P, Q and R, developed a fault in their first year.
The table shows the information.

Put the three brands in order of the probability that a new washing machine develops a fault in its first year, starting with the least likely.
You must show your working.

Table with columns "Brand", "Machines that developed a fault in their first year". Brand: P; Machines that developed a fault in their first year: 18 out of 400 machines in a survey | Brand: Q; Machines that developed a fault in their first year: 1 in 25 machines | Brand: R; Machines that developed a fault in their first year: 4.2% of machines.

Model answer

Brand P: \(\dfrac{18}{400} = 0.045\) (4.5%)
Brand Q: 1 in 25 \(= \dfrac{1}{25} = 0.04\) (4%)
Brand R: 4.2% \(= 0.042\)
Order, least likely first: Q (0.04), R (0.042), P (0.045)

Explanation

To compare probabilities given in different forms, write them all in the same form - decimals, percentages, or numbers per 1000. A common error is to think that '1 in 25' is a large probability because 25 is bigger than the other numbers, or to read 18 out of 400 as 18%. The value for brand P is an estimate from a survey, so it may not be exact, and the three probabilities here are close together.

Mark scheme
  1. 1 mark

    M1 for \(\dfrac{18}{400}\) or 0.045 or 4.5% (brand P), or \(\dfrac{1}{25}\) written as 0.04 or 4% (brand Q)

    oe, eg 45 or 40 per 1000 machines. Either brand P or brand Q converted to a form that can be compared with 4.2%.

  2. 1 mark

    M1 for all three probabilities in the same form, eg 0.045, 0.04 and 0.042, or 4.5%, 4% and 4.2%

    oe, eg 45, 40 and 42 per 1000 machines, or fractions with a common denominator such as \(\dfrac{45}{1000}\), \(\dfrac{40}{1000}\) and \(\dfrac{42}{1000}\).

  3. 1 mark

    A1 for Q, R, P

    In this order, least likely first. Accept the reverse order (P, R, Q) only if the answer clearly says it starts with the most likely. The order must come from correct values. Common errors: reading 1 in 25 as 25% (or 0.25), or 18 out of 400 as 18%, gives a wrong order and scores M0 for that brand. The question says 'You must show your working': the order with no working scores 0.

Question 4

4 marks

An airline's records show that 72 of 900 passengers who had booked seats did not turn up for their flight.

A plane has 180 seats. The airline sells more than 180 tickets for each flight, because some passengers will not turn up.
The airline wants the expected number of passengers who turn up for a flight to be no more than 180.

Use the records to work out the greatest number of tickets the airline should sell for a flight.

Model answer

P(a passenger turns up) \(= \dfrac{900 - 72}{900} = \dfrac{828}{900} = 0.92\)
If n tickets are sold, the expected number who turn up is \(0.92n\).
\(0.92n \le 180\), so \(n \le 180 \div 0.92 = 195.65...\)
Check: \(195 \times 0.92 = 179.4\) and \(196 \times 0.92 = 180.32\)
The greatest number of tickets is 195.

Explanation

Expected frequency = probability \(\times\) number of trials, so here the expected number of passengers who turn up is 0.92 \(\times\) the number of tickets sold. Work backwards by dividing 180 by 0.92, then round down, because 196 tickets would give an expected number above 180. A common error is to add 8% to 180, which gives 194.

Mark scheme
  1. 1 mark

    M1 for P(turns up) \(= \dfrac{828}{900}\) or 0.92, or P(does not turn up) \(= \dfrac{72}{900}\) or 0.08

    oe, eg 92%, \(\dfrac{23}{25}\)

  2. 1 mark

    M1 for \(180 \div 0.92\) oe, or \(n \times 0.92 = 180\), or a trial of a number of tickets \(\times\) 0.92

    oe, eg \(\dfrac{180}{828} \times 900\). A trial must use the probability of turning up, eg \(195 \times 0.92 = 179.4\).

  3. 1 mark

    A1 for 195.6(5...), or both \(195 \times 0.92 = 179.4\) and \(196 \times 0.92 = 180.32\)

    Accept 195.7. For the trial method, both trials (one below 180 and one above) are needed.

  4. 1 mark

    A1 for 195

    Must be a whole number of tickets, rounded down: 196 tickets give an expected 180.32 passengers, which is more than 180. 196 scores M1M1A1A0. \(180 \times 1.08 = 194.4\), giving 194, scores M1M0A0A0. Correct answer with no working scores full marks.

Ready to try the rest? Every answer you write is marked against the mark scheme, so you can see exactly where the marks are.

Study Helper Hints first, answers after you try

Stuck on this one? Ask for a hint and I’ll point you in the right direction, without giving the answer away. Once you’ve checked your answer, I’ll show you how the marks are awarded.