
Level:
Correct: 0
Incorrect: 0
Marks: 0/0
Exam Practice
Course:
Topics:
AQA GCSE Statistics (Higher Paper 2) Smart practice A mixed round aimed at your weak spots
Unit 1
Planning and collecting data
Unit 2
Representing data
Section C: C1a (tabulation, tally, pictogram); Section E: E3d
Tabulation, tallies, pictograms and tables of data
Section C: C1a (pie chart), C1b (comparative pie chart)
Pie charts and comparative pie charts
Section C: C1a (stem and leaf diagram)
Stem and leaf diagrams
Section C: C2 (bar charts, bar line charts, line charts, frequency polygons)
Bar charts, line charts and frequency polygons
Section C: C2 (cumulative frequency charts)
Cumulative frequency diagrams
Section C: C2 (histograms), C3b
Histograms and frequency density
Section C: C2 (box plots); Section D: D3b; Section E: E5b
Box plots and outliers
Unit 3
Summarising data
Section D: D1a (mode, median, arithmetic mean)
Mode, median and mean
Section D: D1a (weighted mean, geometric mean), D1b
Weighted mean, geometric mean and choosing an average
Section D: D2; Section E: E5a
Skewness
Section D: D3a (range, quartiles, IQR, percentiles, interpercentile and interdecile range)
Range, quartiles, percentiles and interdecile range
Section D: D3a (standard deviation)
Standard deviation
Section C: C2 (time series); Section D: D1a (mean seasonal variation), D4; Section E: E6
Time series, moving averages and seasonal variation
Section C: C2 (scatter charts); Section D: D5
Scatter diagrams, lines of best fit and regression lines
Section D: D6; Section E: E9a, E9b, E9c
Spearman's rank correlation coefficient
Unit 4
Probability
Unit 5
Interpreting and evaluating results
Unit 6
Statistical enquiry cycle
3.6 Statistical enquiry cycle: 3.6.1 Initial planning, 3.6.2 Data collection
Statistical enquiry cycle: planning and data collection
3.6 Statistical enquiry cycle: 3.6.3 Processing and presentation, 3.6.4 Interpretation, 3.6.5 Evaluation
Statistical enquiry cycle: analysis and evaluation
Avg
score:
–
Topics
done:
0/39

Box plots and outliers

Practise 17 exam-style questions on Box plots and outliers for AQA GCSE Statistics (Higher Paper 2). Write your answer as you would in the exam and get it marked in seconds against the mark scheme, point by point, with the Study Helper on hand if you get stuck.

  • 17 questions
  • 1–5 marks each
  • Instant marking
  • No sign-up needed
17 questions, marked as you go

Sample questions with model answers

Here are 4 of the questions in this topic, each with a model answer, an explanation of why it earns the marks and the mark scheme an examiner would use.

Question 1

1 mark

The box plot shows the amounts of money raised by 50 students in a sponsored silence.

Jo says,
"The mean amount raised is probably less than £20."

Do you agree with Jo?
Give a reason for your answer.
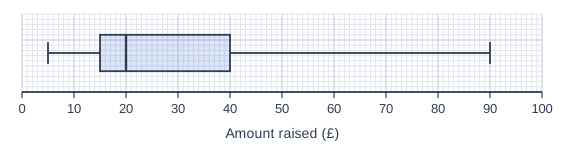
A box plot drawn above a horizontal scale "Amount raised (£)" from 0 to 100, numbered every 10, with 10 small squares between numbered values (each small square is 1), on a grid of small squares. The box plot: lowest value (left end of the left whisker) 5; lower quartile (left side of the box) 15; median (line inside the box) 20; upper quartile (right side of the box) 40; highest value (right end of the right whisker) 90.

Model answer

No, I do not agree with Jo.
The median amount is £20. The median is much closer to the lower quartile (£15) than to the upper quartile (£40), and the right whisker (£40 to £90) is much longer than the left whisker (£5 to £15), so the amounts are positively skewed.
A few students raised large amounts, and these pull the mean up but do not change the median, so the mean is likely to be more than £20.

Explanation

In a positively skewed distribution the values above the median are much more spread out than the values below it. The mean uses every value, so the long tail of large values makes it larger than the median, which depends only on the middle value. Students often mix up the directions: positive skew has its long tail on the right, towards the higher values.

Mark scheme
  1. 1 mark

    B1 for No (the mean is likely to be more than £20), with a reason, eg the median is £20 and the amounts are positively skewed, so the few large amounts pull the mean above the median

    oe. The decision and a reason are both needed for the mark. The reason must use the skew or its features, eg 'positive skew', 'the right whisker is much longer than the left whisker', 'the median is much closer to the lower quartile than to the upper quartile', or 'a few students raised large amounts (up to £90), which increase the mean but not the median'. 'No' with no reason B0. 'Yes' B0. 'No, because the median is £20' with no reference to the skew or the large amounts B0. 'No, the mean is always bigger than the median' B0. Ignore any non-contradictory or irrelevant statements.
Question 2

2 marks

31 students in Year 7 played a memory game.
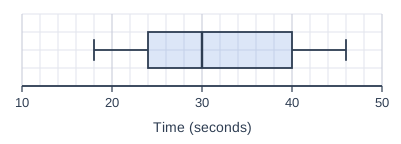
The box plot shows the times, in seconds, that they took.

Tom says,
"More students took between 30 and 40 seconds than took between 24 and 30 seconds, because that part of the box is longer."

Explain why Tom is wrong.
What does the longer part of the box tell you about the times?

A box plot drawn above a horizontal scale "Time (seconds)" from 10 to 50, numbered every 10, with 5 small squares between numbered values (each small square is 2), on a grid of small squares. The box plot: lowest value (left end of the left whisker) 18; lower quartile (left side of the box) 24; median (line inside the box) 30; upper quartile (right side of the box) 40; highest value (right end of the right whisker) 46.

Model answer

Tom is wrong. The lower quartile (24 s), the median (30 s) and the upper quartile (40 s) split the students into quarters, so the part of the box from 24 to 30 seconds and the part from 30 to 40 seconds each contain about a quarter of the students, about 8 of the 31. The lengths of the parts do not show how many students are in them.

The longer part of the box shows that the times between 30 and 40 seconds are more spread out than the times between 24 and 30 seconds, which are bunched closer together.

Explanation

The five values of a box plot split the data into four parts with about the same number of values in each. A longer part means the values in it are more spread out, and a shorter part means they are more concentrated; it does not mean that more values are in it. Reading length as frequency is a common misreading of box plots.

Mark scheme
  1. 1 mark

    B1 for each of the two parts of the box (from the lower quartile, 24, to the median, 30, and from the median to the upper quartile, 40) contains about a quarter of the students, so about the same number of students (about 8 of the 31) took between 24 and 30 seconds as took between 30 and 40 seconds

    oe, eg 'each section of a box plot has 25% of the data, whatever its length'. The answer must refer to each part holding a quarter (25%) of the students, or to the two parts holding the same number. 'The length shows how spread out the times are, not how many students there are' on its own earns the second B1, not this one. 'The box plot does not show frequencies' alone scores B0. Any values stated must be correct: with 31 students the quartiles are the 8th, 16th and 24th times, so each part holds about 8 students (7 strictly between the two values that mark its ends, 9 counting both ends); accept 7, 8 or 9.

  2. 1 mark

    B1 for the times between 30 and 40 seconds (between the median and the upper quartile) are more spread out than the times between 24 and 30 seconds

    oe, eg 'the slower half of the middle 50% of times vary more'; 'the times from 24 to 30 seconds are closer together (more concentrated)'. Also accept 'the times are positively skewed' only with a reference to the times above the median being more spread out. 'More students took longer times' scores B0 (the same misreading as Tom's). Ignore any non-contradictory or irrelevant statements.

Question 3

3 marks

Two cycling clubs, A and B, took part in a sponsored ride.
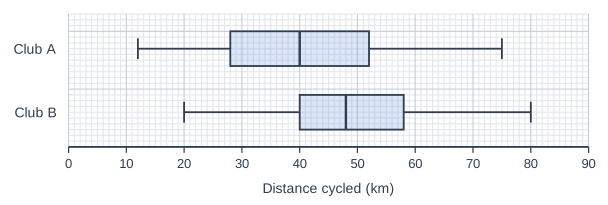
The box plots show the distances, in km, cycled by the 80 members of Club A and the 60 members of Club B.

The captain of Club B says,
"More of our members cycled over 40 km than members of Club A did."

Is the captain correct?
You must show your working.

2 box plots, one above the other, drawn above a horizontal scale "Distance cycled (km)" from 0 to 90, numbered every 10, with 10 small squares between numbered values (each small square is 1), on a grid of small squares. "Club A" (top): lowest value (left end of the left whisker) 12; lower quartile (left side of the box) 28; median (line inside the box) 40; upper quartile (right side of the box) 52; highest value (right end of the right whisker) 75. "Club B" (bottom): lowest value (left end of the left whisker) 20; lower quartile (left side of the box) 40; median (line inside the box) 48; upper quartile (right side of the box) 58; highest value (right end of the right whisker) 80.

Model answer

Club A: 40 km is the median, so about half of the 80 members cycled over 40 km: \(\dfrac{1}{2} \times 80 = 40\) members.
Club B: 40 km is the lower quartile, so about three quarters of the 60 members cycled over 40 km: \(\dfrac{3}{4} \times 60 = 45\) members.
45 > 40, so the captain is correct: about 45 members of Club B cycled over 40 km, compared with about 40 members of Club A.

Explanation

The median has about half of the values above it and the lower quartile has about three quarters above it. Because the clubs are different sizes, turn these fractions into numbers of members before comparing: the claim is about how many members, not what proportion. A common error is to compare the medians, or to compare 50% with 75% without using the sizes of the clubs.

Mark scheme
  1. 1 mark

    M1 for recognising that about half of Club A and about three quarters of Club B cycled over 40 km, eg \(\dfrac{1}{2} \times 80\) or \(\dfrac{3}{4} \times 60\)

    oe. 40 km is the median for Club A and the lower quartile for Club B. Sight of 50% and 75% (or a half and three quarters) with no numbers of members scores M1A0B0: the claim is about numbers of members, and the clubs are different sizes.

  2. 1 mark

    A1 for 40 (Club A) and 45 (Club B)

    Both needed. Accept 'about 40' and 'about 45'.

  3. 1 mark

    B1dep for Yes, the captain is correct, as 45 > 40

    oe. The decision must be supported by the two numbers. 'Yes, because Club B's median is higher' scores M0A0B0. The question says 'You must show your working': 'Yes' with no working scores 0.

Question 4

4 marks

Ed weighed a sample of apples from an orchard.
The lower quartile of the masses is 131 g and the upper quartile is \(x\) g.
The two heaviest apples in the sample have masses of 160 g and 164 g.

The apple with a mass of 164 g is an outlier, but the apple with a mass of 160 g is not an outlier.

Work out the range of possible values of \(x\).
Give your answer as an inequality.

Model answer

IQR = \(x - 131\)
Upper limit for outliers = \(x + 1.5(x - 131) = 2.5x - 196.5\)
164 g is an outlier: \(164 > 2.5x - 196.5\), so \(2.5x < 360.5\) and \(x < 144.2\)
160 g is not an outlier: \(160 \le 2.5x - 196.5\), so \(2.5x \ge 356.5\) and \(x \ge 142.6\)
So \(142.6 \le x < 144.2\)

Explanation

Write the upper outlier limit in terms of \(x\), then use the two facts: 164 is above the limit and 160 is not. Each gives an inequality, and together they give the range of possible upper quartiles. A common error is to write the IQR as \(x\) instead of \(x - 131\).

Mark scheme
  1. 1 mark

    M1 for the upper limit \(x + 1.5(x - 131)\) oe

    oe, eg \(2.5x - 196.5\). Using \(x + 1.5x\) (forgetting to subtract the lower quartile) M0.

  2. 1 mark

    M1dep for \(164 > x + 1.5(x - 131)\) or \(160 \le x + 1.5(x - 131)\) oe

    oe. An equation using 164 or 160 instead of an inequality is acceptable for this mark, eg \(2.5x - 196.5 = 164\).

  3. 1 mark

    A1 for \(x < 144.2\) or \(x \ge 142.6\)

    Or 144.2 or 142.6 seen as a boundary value.

  4. 1 mark

    A1 for \(142.6 \le x < 144.2\)

    oe. Condone < or ≤ at either end. Both 142.6 and 144.2 found but not combined into one inequality, or written the wrong way round: M1M1A1A0. Correct answer with no working scores 4.

Ready to try the rest? Every answer you write is marked against the mark scheme, so you can see exactly where the marks are.

Study Helper Hints first, answers after you try

Stuck on this one? Ask for a hint and I’ll point you in the right direction, without giving the answer away. Once you’ve checked your answer, I’ll show you how the marks are awarded.