
Level:
Correct: 0
Incorrect: 0
Marks: 0/0
Exam Practice
Course:
Topics:
AQA GCSE Statistics (Higher Paper 2) Smart practice A mixed round aimed at your weak spots
Unit 1
Planning and collecting data
Unit 2
Representing data
Section C: C1a (tabulation, tally, pictogram); Section E: E3d
Tabulation, tallies, pictograms and tables of data
Section C: C1a (pie chart), C1b (comparative pie chart)
Pie charts and comparative pie charts
Section C: C1a (stem and leaf diagram)
Stem and leaf diagrams
Section C: C2 (bar charts, bar line charts, line charts, frequency polygons)
Bar charts, line charts and frequency polygons
Section C: C2 (cumulative frequency charts)
Cumulative frequency diagrams
Section C: C2 (histograms), C3b
Histograms and frequency density
Section C: C2 (box plots); Section D: D3b; Section E: E5b
Box plots and outliers
Unit 3
Summarising data
Section D: D1a (mode, median, arithmetic mean)
Mode, median and mean
Section D: D1a (weighted mean, geometric mean), D1b
Weighted mean, geometric mean and choosing an average
Section D: D2; Section E: E5a
Skewness
Section D: D3a (range, quartiles, IQR, percentiles, interpercentile and interdecile range)
Range, quartiles, percentiles and interdecile range
Section D: D3a (standard deviation)
Standard deviation
Section C: C2 (time series); Section D: D1a (mean seasonal variation), D4; Section E: E6
Time series, moving averages and seasonal variation
Section C: C2 (scatter charts); Section D: D5
Scatter diagrams, lines of best fit and regression lines
Section D: D6; Section E: E9a, E9b, E9c
Spearman's rank correlation coefficient
Unit 4
Probability
Unit 5
Interpreting and evaluating results
Unit 6
Statistical enquiry cycle
3.6 Statistical enquiry cycle: 3.6.1 Initial planning, 3.6.2 Data collection
Statistical enquiry cycle: planning and data collection
3.6 Statistical enquiry cycle: 3.6.3 Processing and presentation, 3.6.4 Interpretation, 3.6.5 Evaluation
Statistical enquiry cycle: analysis and evaluation
Avg
score:
–
Topics
done:
0/39

Estimating population characteristics from samples

Practise 15 exam-style questions on Estimating population characteristics from samples for AQA GCSE Statistics (Higher Paper 2). Write your answer as you would in the exam and get it marked in seconds against the mark scheme, point by point, with the Study Helper on hand if you get stuck.

  • 15 questions
  • 1–5 marks each
  • Instant marking
  • No sign-up needed
15 questions, marked as you go

Sample questions with model answers

Here are 4 of the questions in this topic, each with a model answer, an explanation of why it earns the marks and the mark scheme an examiner would use.

Question 1

1 mark

Which of these is the main advantage of using a larger random sample to estimate a population mean?

Choose your answer.

  • It removes any bias caused by the way the sample is chosen
  • The estimate is likely to be closer to the population mean
  • It is quicker and cheaper to collect the data
  • It guarantees that the estimate is correct

Model answer

The estimate is likely to be closer to the population mean.

Explanation

Larger random samples are less affected by a few unusual values, so their means vary less from sample to sample and are more reliable. But size cannot fix a biased method, larger samples cost more, and any sample can still give an estimate that is a little out.

Mark scheme
  1. 1 mark

    B1 for The estimate is likely to be closer to the population mean

    Any other answer, or more than one answer, scores B0. A larger sample does not remove bias from a poor sampling method, costs more time and money, and can never guarantee an exact estimate.
Question 2

2 marks

Kai wants to estimate the mean number of hours that teenagers spend playing video games each week.
He puts a questionnaire on a website about video games and gets 500 replies.

Kai says,
"My sample is very large, so my estimate will be reliable."

Give two reasons why Kai is wrong.

Model answer

1. The sample is biased. Teenagers who visit a website about video games are likely to play more video games than teenagers in general, so his estimate of the mean is likely to be too high.
2. Making a biased sample larger does not remove the bias. A large sample only gives a reliable estimate if it is representative of the population, for example a random sample.

Explanation

Sample size and sampling method do different jobs: a larger sample reduces random variation, but only a good method (such as random sampling) avoids bias. Five hundred replies from keen gamers will give a very consistent - but wrong - estimate for all teenagers.

Mark scheme
  1. 2 marks

    B2 for two different reasons from:
    the sample is not representative (biased): teenagers who visit a video games website and choose to reply are likely to play more video games than other teenagers, so his estimate is likely to be too high
    a large sample does not remove bias: a larger biased sample still gives a biased estimate (a large sample only helps if it is representative, eg chosen at random)
    anyone can reply to a questionnaire on a website, so some of the replies may not be from teenagers (he cannot check their ages)
    the hours are reported by the people who reply, so they may be guesses or exaggerated
    the same person could reply more than once

    1 mark for each different reason, max 2 (B1 for one). 'The sample is biased' or 'it is not representative' with no reason scores B0. Reasons that keen gamers are more likely to visit the website or to reply count as one reason. Accept 'sample size only helps if the sample is chosen at random' or 'the size does not matter if the people are not representative' for the second reason. Do not accept 'the sample is too small' (500 is large). Ignore any non-contradictory or irrelevant statements.

Question 3

3 marks

A bus company claims that fewer than 10% of its journeys from the town centre to the railway station take more than 30 minutes.

Ruth recorded the times of a random sample of 15 of these journeys.
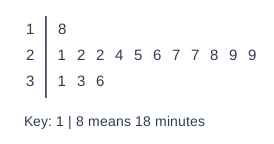
The stem-and-leaf diagram shows her results.

Use Ruth's sample to estimate the percentage of all these journeys that take more than 30 minutes.
Comment on the bus company's claim.

Stem and leaf diagram. Key: 1 | 8 means 18 minutes. Rows (stem | leaves): 1 | 8; 2 | 1 2 2 4 5 6 7 7 8 9 9; 3 | 1 3 6.

Model answer

Journeys over 30 minutes in the sample: 31, 33 and 36, so 3 out of 15.
\(\dfrac{3}{15} \times 100 = 20\%\)
The sample suggests that about 20% of journeys take more than 30 minutes, which is more than the 10% claimed, so it casts doubt on the claim. However, the sample is only 15 journeys: each journey is about 6.7% of the sample, so one or two journeys make a big difference. More journeys should be timed before deciding.

Explanation

The proportion in the sample estimates the proportion of all journeys. A small sample can easily give a proportion that is some way from the true value, so a conclusion should mention this. Here even 2 slow journeys would give 13%, still above 10%, but the evidence is not strong.

Mark scheme
  1. 1 mark

    M1 for \(\dfrac{3}{15}\) oe

    oe, eg 0.2

  2. 1 mark

    A1 for 20(%)

    Correct answer with no working scores M1A1.

  3. 1 mark

    B1ft for a comment that compares the estimate with 10% and refers to the small sample, eg the sample suggests the claim is wrong (20% is more than 10%), but with only 15 journeys we cannot be sure / more journeys should be timed

    ft their percentage. Both parts are needed: the comparison with 10% and a reason for caution (small sample of 15 / each journey is about 6.7% of the sample / a different sample could give a different result). Accept 'the sample does not support the claim, but the sample is too small to be sure'. 'The claim is wrong because 20% > 10%' with no caution scores B0. Ignore any non-contradictory or irrelevant statements.

Question 4

4 marks

A delivery driver timed a random sample of 20 of her deliveries.
The mean time was 6.5 minutes and the standard deviation was 2.0 minutes.

Tomorrow she has 48 deliveries.

Estimate the total time she will spend on the 48 deliveries.

She says,
"The mean time of tomorrow's 48 deliveries is likely to be closer to 6.5 minutes than the time of a single delivery is."

Explain why she is right.
State one assumption you have made.

Model answer

Estimated total time \(= 6.5 \times 48 = 312\) minutes (5 hours 12 minutes)
Single deliveries vary a lot: with a standard deviation of 2 minutes, one delivery could easily take 4 minutes or 9 minutes. Over 48 deliveries the long and short times tend to balance each other out, so the mean of the 48 times is likely to be much closer to 6.5 minutes than any single time.
Assumption: tomorrow's deliveries are similar to the ones in her sample, so their mean time is about 6.5 minutes.

Explanation

The sample mean estimates the mean time per delivery, so the total is estimated by multiplying by 48. A set of sample means is more closely distributed than individual values, because averaging cancels out much of the variation - which is why an estimate for many deliveries is more dependable than a prediction for one.

Mark scheme
  1. 1 mark

    M1 for \(6.5 \times 48\)

    oe

  2. 1 mark

    A1 for 312 (minutes)

    Accept 5 hours 12 minutes or 5.2 hours. Correct answer with no working scores M1A1.

  3. 1 mark

    B1 for an explanation, eg the times of single deliveries vary a lot (standard deviation 2 minutes), but over 48 deliveries long and short times tend to balance out, so a mean of many times is less variable than one time

    oe. Accept 'means are more closely distributed than individual values', 'extreme times are averaged out'. Do not accept 'because 48 is a large number' or 'because the sample was random' with no idea of balancing out.

  4. 1 mark

    B1 for an assumption, eg tomorrow's deliveries are similar to those in the sample / the sample of 20 is representative of her deliveries / the population mean is about 6.5 minutes

    oe. Accept 'traffic and weather tomorrow will be similar'. Do not accept 'the sample is random' (it is given). Ignore any non-contradictory or irrelevant statements.

Ready to try the rest? Every answer you write is marked against the mark scheme, so you can see exactly where the marks are.

Study Helper Hints first, answers after you try

Stuck on this one? Ask for a hint and I’ll point you in the right direction, without giving the answer away. Once you’ve checked your answer, I’ll show you how the marks are awarded.