
Level:
Correct: 0
Incorrect: 0
Marks: 0/0
Exam Practice
Course:
Topics:
AQA GCSE Statistics (Higher Paper 2) Smart practice A mixed round aimed at your weak spots
Unit 1
Planning and collecting data
Unit 2
Representing data
Section C: C1a (tabulation, tally, pictogram); Section E: E3d
Tabulation, tallies, pictograms and tables of data
Section C: C1a (pie chart), C1b (comparative pie chart)
Pie charts and comparative pie charts
Section C: C1a (stem and leaf diagram)
Stem and leaf diagrams
Section C: C2 (bar charts, bar line charts, line charts, frequency polygons)
Bar charts, line charts and frequency polygons
Section C: C2 (cumulative frequency charts)
Cumulative frequency diagrams
Section C: C2 (histograms), C3b
Histograms and frequency density
Section C: C2 (box plots); Section D: D3b; Section E: E5b
Box plots and outliers
Unit 3
Summarising data
Section D: D1a (mode, median, arithmetic mean)
Mode, median and mean
Section D: D1a (weighted mean, geometric mean), D1b
Weighted mean, geometric mean and choosing an average
Section D: D2; Section E: E5a
Skewness
Section D: D3a (range, quartiles, IQR, percentiles, interpercentile and interdecile range)
Range, quartiles, percentiles and interdecile range
Section D: D3a (standard deviation)
Standard deviation
Section C: C2 (time series); Section D: D1a (mean seasonal variation), D4; Section E: E6
Time series, moving averages and seasonal variation
Section C: C2 (scatter charts); Section D: D5
Scatter diagrams, lines of best fit and regression lines
Section D: D6; Section E: E9a, E9b, E9c
Spearman's rank correlation coefficient
Unit 4
Probability
Unit 5
Interpreting and evaluating results
Unit 6
Statistical enquiry cycle
3.6 Statistical enquiry cycle: 3.6.1 Initial planning, 3.6.2 Data collection
Statistical enquiry cycle: planning and data collection
3.6 Statistical enquiry cycle: 3.6.3 Processing and presentation, 3.6.4 Interpretation, 3.6.5 Evaluation
Statistical enquiry cycle: analysis and evaluation
Avg
score:
–
Topics
done:
0/39

Tabulation, tallies, pictograms and tables of data

Practise 14 exam-style questions on Tabulation, tallies, pictograms and tables of data for AQA GCSE Statistics (Higher Paper 2). Write your answer as you would in the exam and get it marked in seconds against the mark scheme, point by point, with the Study Helper on hand if you get stuck.

  • 14 questions
  • 1–5 marks each
  • Instant marking
  • No sign-up needed
14 questions, marked as you go

Sample questions with model answers

Here are 4 of the questions in this topic, each with a model answer, an explanation of why it earns the marks and the mark scheme an examiner would use.

Question 1

1 mark

Jade is making a pictogram. One circle represents 6 people.
She can use whole circles and quarter, half or three-quarter circles.

Which one of these numbers of people cannot be shown exactly on her pictogram?

Choose your answer.

  • 3
  • 4
  • 9
  • 21

Model answer

A quarter of a circle represents \(6 \div 4 = 1.5\) people.
3 people = half a circle, 9 people = 1.5 circles, 21 people = 3.5 circles.
4 people = \(\dfrac{4}{6} = \dfrac{2}{3}\) of a circle, which cannot be made from quarters.

Answer: 4

Explanation

Work out what the smallest part of a symbol represents: with a key of 6 people, a quarter circle is 1.5 people. Any number that is a multiple of 1.5 can be shown with whole and part circles, even if it is not a multiple of 6. 4 is not a multiple of 1.5, so it would need two thirds of a circle.

Mark scheme
  1. 1 mark

    B1 for 4

    Any other answer, or more than one answer, scores B0. A quarter circle represents 6 ÷ 4 = 1.5 people, so a number of people can be shown exactly only if it is a multiple of 1.5: 3 is half a circle, 9 is 1.5 circles and 21 is 3.5 circles, but 4 people would need two thirds of a circle. Choosing 3, 9 or 21 usually comes from thinking that only multiples of 6 can be shown.
Question 2

2 marks

A vet recorded the type of each animal she saw one morning and whether it was the animal's first visit.

C = cat   D = dog   R = rabbit
Y = first visit   N = not a first visit

CY   DN   DY   RN   CN   DN   CY   DY   RN   DN
CN   CY   DN   RY   DY   CN   DN   CY   RN   DN

What fraction of the dogs were on their first visit?
You may use a two-way table to help you.

Model answer

Two-way table:
Cat: first visit 4, not first visit 3, total 7
Dog: first visit 3, not first visit 6, total 9
Rabbit: first visit 1, not first visit 3, total 4
Total: 8, 12, 20

Fraction of the dogs on their first visit \(= \dfrac{3}{9} = \dfrac{1}{3}\)

Explanation

Tabulating the coded data in a two-way table (type of animal against first visit or not) makes the counts easy to read and check: the total must be 20. The question asks for a fraction of the dogs, so the denominator is the number of dogs, 9. Dividing by the number of first visits (8) or by all 20 animals answers a different question.

Mark scheme
  1. 1 mark

    M1 for 9 dogs and 3 dogs on their first visit

    May be seen in a two-way table: cat 4 Y and 3 N (7); dog 3 Y and 6 N (9); rabbit 1 Y and 3 N (4); totals 8 Y, 12 N, 20 animals.

  2. 1 mark

    A1 for \(\dfrac{1}{3}\)

    oe, eg \(\dfrac{3}{9}\), 0.333..., 33.3%. Correct answer with no working scores 2 marks. \(\dfrac{3}{8}\) (the fraction of the first visits that were dogs) scores M0A0 unless 9 dogs is also seen (then M1A0). \(\dfrac{3}{20}\) scores M0A0 unless 9 dogs is also seen (then M1A0).

Question 3

3 marks

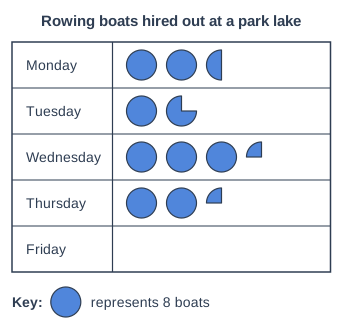
The pictogram shows the number of rowing boats hired out at a park lake on Monday, Tuesday, Wednesday and Thursday of one week.
The row for Friday has not been completed.

The mean number of rowing boats hired out each day from Monday to Friday was 21.6

Work out the number of rowing boats hired out on Friday.

Pictogram titled "Rowing boats hired out at a park lake", a table with 5 rows of circle symbols. Key: one circle represents 8 boats. Monday: 2 and a half circles. Tuesday: 1 and three quarters circles. Wednesday: 3 and a quarter circles. Thursday: 2 and a quarter circles. Friday: blank row (nothing drawn yet).

Model answer

Total for the five days \(= 21.6 \times 5 = 108\) boats
Monday to Thursday: \(20 + 14 + 26 + 18 = 78\) boats (9.75 circles, and \(9.75 \times 8 = 78\))
Friday \(= 108 - 78 = 30\) boats

Explanation

Work backwards from the mean: mean × number of days gives the total for all five days. Read the four complete rows using the key (each quarter circle is 2 boats), then subtract their total. Common errors are multiplying the mean by 4 instead of 5 and misreading the part circles.

Mark scheme
  1. 1 mark

    M1 for \(21.6 \times 5\) or 108

    oe

  2. 1 mark

    M1 for \(20 + 14 + 26 + 18\) or 78

    oe, eg 9.75 circles × 8. Monday 2.5 circles (20), Tuesday 1.75 circles (14), Wednesday 3.25 circles (26), Thursday 2.25 circles (18). The day values may be seen separately. This mark is independent of the first M1.

  3. 1 mark

    A1 for 30

    Award only if both M marks are scored. Correct answer with no working scores 3 marks. 3.75 (the number of circles for Friday) with 30 not stated scores M1M1A0. Using four days (\(21.6 \times 4 - 78 = 8.4\)) scores M0M1A0. 108 as the final answer scores M1M0A0.

Question 4

4 marks

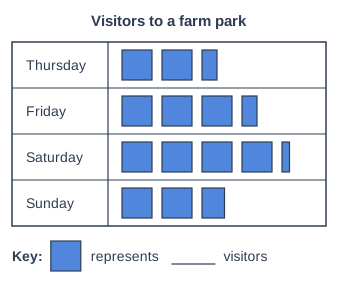
The pictogram shows the number of visitors to a farm park on four days.
The number of visitors that one square represents is missing from the key.

There were 30 more visitors on Saturday than on Sunday.

Work out the mean number of visitors per day for these four days.

Pictogram titled "Visitors to a farm park", a table with 4 rows of square symbols. Key: one square represents a number of visitors that is left blank. Thursday: 2 and a half squares. Friday: 3 and a half squares. Saturday: 4 and a quarter squares. Sunday: 2 and three quarters squares.

Model answer

Saturday has 4.25 squares and Sunday has 2.75 squares, a difference of 1.5 squares.
1.5 squares represent 30 visitors, so one square represents \(30 \div 1.5 = 20\) visitors.
Total squares \(= 2.5 + 3.5 + 4.25 + 2.75 = 13\)
Total visitors \(= 13 \times 20 = 260\)
Mean \(= 260 \div 4 = 65\) visitors per day

Explanation

The difference between two rows, in squares, matches the difference in visitors, which gives the key: 1.5 squares for 30 visitors means one square is 20 visitors. Then find the total and divide by the number of days. Count the part squares carefully: a quarter square here is 5 visitors.

Mark scheme
  1. 1 mark

    M1 for \(4.25 - 2.75 = 1.5\) squares represent 30 visitors

    oe, eg \(30 \div 1.5\), or 6 quarter squares represent 30 visitors. Saturday has 4 and a quarter squares and Sunday 2 and three-quarter squares.

  2. 1 mark

    A1 for one square represents 20 visitors

    oe, eg a quarter square represents 5 visitors.

  3. 1 mark

    M1 for \(\dfrac{13 \times \text{their } 20}{4}\) or \(\dfrac{\text{their } 260}{4}\)

    13 squares altogether (2.5 + 3.5 + 4.25 + 2.75). Day totals with a key of 20: Thursday 50, Friday 70, Saturday 85, Sunday 55, total 260. ft their key. Also award for the mean number of squares, 3.25, multiplied by their key.

  4. 1 mark

    A1 for 65

    Correct answer with no working scores 4 marks. 260 (the total) as the final answer scores M1A1M0A0. 3.25 (the mean number of squares) with no key found scores 0.

Ready to try the rest? Every answer you write is marked against the mark scheme, so you can see exactly where the marks are.

Study Helper Hints first, answers after you try

Stuck on this one? Ask for a hint and I’ll point you in the right direction, without giving the answer away. Once you’ve checked your answer, I’ll show you how the marks are awarded.