
Level:
Correct: 0
Incorrect: 0
Marks: 0/0
Exam Practice
Course:
Topics:
AQA GCSE Statistics (Higher Paper 2) Smart practice A mixed round aimed at your weak spots
Unit 1
Planning and collecting data
Unit 2
Representing data
Section C: C1a (tabulation, tally, pictogram); Section E: E3d
Tabulation, tallies, pictograms and tables of data
Section C: C1a (pie chart), C1b (comparative pie chart)
Pie charts and comparative pie charts
Section C: C1a (stem and leaf diagram)
Stem and leaf diagrams
Section C: C2 (bar charts, bar line charts, line charts, frequency polygons)
Bar charts, line charts and frequency polygons
Section C: C2 (cumulative frequency charts)
Cumulative frequency diagrams
Section C: C2 (histograms), C3b
Histograms and frequency density
Section C: C2 (box plots); Section D: D3b; Section E: E5b
Box plots and outliers
Unit 3
Summarising data
Section D: D1a (mode, median, arithmetic mean)
Mode, median and mean
Section D: D1a (weighted mean, geometric mean), D1b
Weighted mean, geometric mean and choosing an average
Section D: D2; Section E: E5a
Skewness
Section D: D3a (range, quartiles, IQR, percentiles, interpercentile and interdecile range)
Range, quartiles, percentiles and interdecile range
Section D: D3a (standard deviation)
Standard deviation
Section C: C2 (time series); Section D: D1a (mean seasonal variation), D4; Section E: E6
Time series, moving averages and seasonal variation
Section C: C2 (scatter charts); Section D: D5
Scatter diagrams, lines of best fit and regression lines
Section D: D6; Section E: E9a, E9b, E9c
Spearman's rank correlation coefficient
Unit 4
Probability
Unit 5
Interpreting and evaluating results
Unit 6
Statistical enquiry cycle
3.6 Statistical enquiry cycle: 3.6.1 Initial planning, 3.6.2 Data collection
Statistical enquiry cycle: planning and data collection
3.6 Statistical enquiry cycle: 3.6.3 Processing and presentation, 3.6.4 Interpretation, 3.6.5 Evaluation
Statistical enquiry cycle: analysis and evaluation
Avg
score:
–
Topics
done:
0/39

Correlation, causation and association

Practise 15 exam-style questions on Correlation, causation and association for AQA GCSE Statistics (Higher Paper 2). Write your answer as you would in the exam and get it marked in seconds against the mark scheme, point by point, with the Study Helper on hand if you get stuck.

  • 15 questions
  • 1–5 marks each
  • Instant marking
  • No sign-up needed
15 questions, marked as you go

Sample questions with model answers

Here are 4 of the questions in this topic, each with a model answer, an explanation of why it earns the marks and the mark scheme an examiner would use.

Question 1

1 mark

For a large group of adults, which of these pairs of variables is most likely to have zero correlation?

Choose your answer.

  • hours worked last week and pay for last week
  • house number and shoe size
  • number of cigarettes smoked each day and lung capacity
  • distance driven last year and amount spent on fuel last year

Model answer

House number and shoe size.
There is no reason for a person's house number to be linked to their shoe size, so there should be no pattern: zero correlation.

Explanation

Zero correlation means there is no pattern linking the two variables: as one increases, the other does not tend to increase or decrease. Each of the other pairs has a clear link - pay and fuel spending tend to rise with hours and distance (positive), and lung capacity tends to fall as smoking increases (negative).

Mark scheme
  1. 1 mark

    B1 for house number and shoe size

    Any other answer, or more than one answer, scores B0. Hours worked and pay would show positive correlation, cigarettes smoked and lung capacity negative correlation, and distance driven and money spent on fuel positive correlation.
Question 2

2 marks

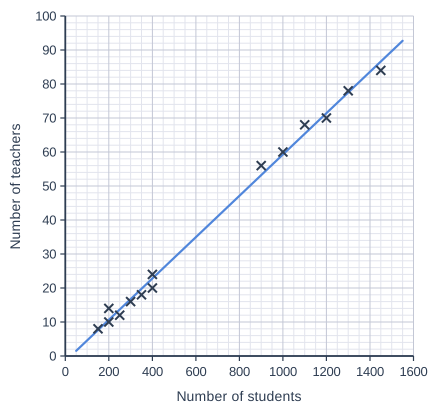
A council recorded the number of students and the number of teachers at each of its 14 schools.
The scatter graph shows the results and a line of best fit.

The council uses the line of best fit to estimate the number of teachers at a school with 650 students.
A councillor says,
"This estimate is reliable because it is interpolation."

Comment on the councillor's statement.

Scatter graph on a grid of small squares. The horizontal axis is "Number of students", from 0 to 1600, numbered every 200, with 4 small squares between numbered values (each small square is 50). The vertical axis is "Number of teachers", from 0 to 100, numbered every 10, with 5 small squares between numbered values (each small square is 2). 14 points are plotted as crosses: (150, 8), (200, 10), (200, 14), (250, 12), (300, 16), (350, 18), (400, 20), (400, 24), (900, 56), (1000, 60), (1100, 68), (1200, 70), (1300, 78) and (1450, 84). A straight line of best fit is drawn from about (50, 1.5) to about (1550, 92.7).

Model answer

The councillor is right that the estimate is interpolation, because 650 is within the range of the data (150 to 1450 students).
However, the estimate may not be reliable. The schools are in two groups - small schools with 150 to 400 students and large schools with 900 to 1450 students - and there are no schools with between 400 and 900 students. We do not know whether a school with 650 students follows the line, so the estimate is not based on any nearby data.

Explanation

Interpolation is usually reliable because the estimate is inside the data, where the pattern has been observed. But if the data have a large gap, an estimate in the gap is no better supported than one outside the data. Always check where the data actually are, not just their smallest and largest values.

Mark scheme
  1. 1 mark

    B1 for agreeing that it is interpolation, eg 650 is within the range of the numbers of students in the data (150 to 1450)

    oe. Accept 'the councillor is right that it is interpolation'. 'It is extrapolation' scores B0.

  2. 1 mark

    B1 for the estimate may not be reliable because there are no schools with between 400 and 900 students, so we do not know whether the relationship follows the line in that gap

    oe. Must refer to the gap in the data (no schools with about 650 students). Accept 'there is no data near 650 students', 'the schools are in two groups, small (primary-sized) and large (secondary-sized), with none in between'. Do not accept 'the correlation is weak' (it is strong), 'the sample is too small' or 'the line does not go through 650'. Ignore any non-contradictory or irrelevant statements.

Question 3

3 marks

A gardening club recorded the number of hours spent watering each week and the total mass of vegetables harvested for each of 30 allotments.
The correlation coefficient between hours spent watering and mass of vegetables harvested is 0.29

Sam says,
"The correlation is weak, so watering makes very little difference to the mass of vegetables an allotment produces."

Interpret the correlation coefficient in context.
Explain why Sam's conclusion may not be correct.

Model answer

0.29 shows a (weak) positive correlation: allotments that were watered for more hours tended to produce a greater mass of vegetables.
Sam may not be correct. The mass of vegetables also depends on many other factors, such as the soil, the amount of sunshine, the size of the allotment and the type of vegetables grown. These factors vary from one allotment to another and interact with watering, so they hide some of its effect and make the correlation weak. A weak correlation does not show that watering makes little difference: to see its effect you would need to compare allotments that are alike in other ways.

Explanation

When an outcome depends on many factors that act together, any one factor on its own may show only a weak correlation with it, even if that factor matters. The correlation coefficient measures how closely the points fit a straight line, not how big an effect one variable has on the other. Sam treats 'weak correlation' as 'no effect', which the data do not show.

Mark scheme
  1. 1 mark

    B1 for positive correlation, in context, eg allotments that were watered for more hours tended to produce a greater mass of vegetables

    oe. Must refer to both watering and the mass of vegetables, and give the direction. 'Weak positive correlation' with no context scores B0. The question does not ask for the strength, so ignore strength words. Do not accept 'watering makes vegetables grow' for this mark (a claim of causation).

  2. 1 mark

    B1 for other factors also affect the mass of vegetables, eg type of soil / amount of sunshine / size of the allotment / type of vegetables grown / pests / use of fertiliser

    oe. At least one factor must be named. 'Other factors' with no example scores B0.

  3. 1 mark

    B1 for so the correlation can be weak even if watering does make a difference, eg the effect of watering is hidden by the other factors, which vary from one allotment to another and interact / to see the effect of watering you would need to compare allotments that are similar in other ways

    oe. Accept 'a weak correlation does not show how much difference watering makes', 'the correlation coefficient measures how closely the points follow a straight line, not the size of the effect', 'watering may matter a lot on dry, sunny allotments but little on shady ones'. 'Correlation does not imply causation' on its own scores B0 here: Sam's mistake is to treat a weak correlation as showing no effect. Ignore any non-contradictory or irrelevant statements.

Question 4

4 marks

A researcher collected data from 300 adults.
She found a positive correlation between the number of cups of coffee an adult drinks each day and their blood pressure.

She also found that the adults who smoke tend to drink more coffee than the adults who do not smoke.
Smoking is known to raise blood pressure.

Explain why her data do not show that drinking coffee raises blood pressure.

Describe how she could use her data to find out more about whether coffee is linked to blood pressure, and say what result would suggest that it is.

Model answer

Correlation does not imply causation. Smoking could explain the correlation: adults who smoke tend to drink more coffee, and smoking raises blood pressure. So adults who drink a lot of coffee may have higher blood pressure because more of them smoke, not because of the coffee.
She could split her data into smokers and non-smokers, and find the correlation between the number of cups of coffee and blood pressure for the non-smokers only (and for the smokers only).
If there is still a positive correlation among the non-smokers, the link between coffee and blood pressure cannot be explained by smoking, which suggests coffee is linked to blood pressure (although it still would not prove that coffee causes it).

Explanation

A third variable that affects both variables can create a correlation between them. One way to see past it is to compare like with like: look only at people with the same value of the third variable (here, non-smokers). If the correlation remains within that group, the third variable cannot be the whole explanation.

Mark scheme
  1. 1 mark

    B1 for correlation does not imply causation

    oe, eg 'a correlation does not prove that one variable causes the other'

  2. 1 mark

    B1 for smoking may explain the correlation: smokers tend to drink more coffee and also have higher blood pressure

    oe. Must link smoking to both coffee drinking and blood pressure, eg 'smoking is a third variable that affects both'. 'Other factors' with no example scores B0.

  3. 1 mark

    B1 for look at the non-smokers on their own (or the smokers and the non-smokers separately) and find the correlation between coffee and blood pressure for that group

    oe. Accept 'draw a scatter graph for the non-smokers only', 'compare adults who smoke the same amount'. Do not accept 'take a bigger sample' (it does not remove the effect of smoking), 'ask people if coffee raises their blood pressure', or a new experiment (the question asks how she could use her data).

  4. 1 mark

    B1dep for if there is still a positive correlation among the non-smokers (or within each group), this suggests coffee is linked to blood pressure

    oe, eg 'if non-smokers who drink more coffee still tend to have higher blood pressure'. The result must be about the group(s) described for the previous mark. Ignore any non-contradictory or irrelevant statements.

Ready to try the rest? Every answer you write is marked against the mark scheme, so you can see exactly where the marks are.

Study Helper Hints first, answers after you try

Stuck on this one? Ask for a hint and I’ll point you in the right direction, without giving the answer away. Once you’ve checked your answer, I’ll show you how the marks are awarded.