
Level:
Correct: 0
Incorrect: 0
Marks: 0/0
Exam Practice
Course:
Topics:
AQA GCSE Statistics (Higher Paper 2) Smart practice A mixed round aimed at your weak spots
Unit 1
Planning and collecting data
Unit 2
Representing data
Section C: C1a (tabulation, tally, pictogram); Section E: E3d
Tabulation, tallies, pictograms and tables of data
Section C: C1a (pie chart), C1b (comparative pie chart)
Pie charts and comparative pie charts
Section C: C1a (stem and leaf diagram)
Stem and leaf diagrams
Section C: C2 (bar charts, bar line charts, line charts, frequency polygons)
Bar charts, line charts and frequency polygons
Section C: C2 (cumulative frequency charts)
Cumulative frequency diagrams
Section C: C2 (histograms), C3b
Histograms and frequency density
Section C: C2 (box plots); Section D: D3b; Section E: E5b
Box plots and outliers
Unit 3
Summarising data
Section D: D1a (mode, median, arithmetic mean)
Mode, median and mean
Section D: D1a (weighted mean, geometric mean), D1b
Weighted mean, geometric mean and choosing an average
Section D: D2; Section E: E5a
Skewness
Section D: D3a (range, quartiles, IQR, percentiles, interpercentile and interdecile range)
Range, quartiles, percentiles and interdecile range
Section D: D3a (standard deviation)
Standard deviation
Section C: C2 (time series); Section D: D1a (mean seasonal variation), D4; Section E: E6
Time series, moving averages and seasonal variation
Section C: C2 (scatter charts); Section D: D5
Scatter diagrams, lines of best fit and regression lines
Section D: D6; Section E: E9a, E9b, E9c
Spearman's rank correlation coefficient
Unit 4
Probability
Unit 5
Interpreting and evaluating results
Unit 6
Statistical enquiry cycle
3.6 Statistical enquiry cycle: 3.6.1 Initial planning, 3.6.2 Data collection
Statistical enquiry cycle: planning and data collection
3.6 Statistical enquiry cycle: 3.6.3 Processing and presentation, 3.6.4 Interpretation, 3.6.5 Evaluation
Statistical enquiry cycle: analysis and evaluation
Avg
score:
–
Topics
done:
0/39

Stratified sampling

Practise 14 exam-style questions on Stratified sampling for AQA GCSE Statistics (Higher Paper 2). Write your answer as you would in the exam and get it marked in seconds against the mark scheme, point by point, with the Study Helper on hand if you get stuck.

  • 14 questions
  • 1–5 marks each
  • Instant marking
  • No sign-up needed
14 questions, marked as you go

Sample questions with model answers

Here are 4 of the questions in this topic, each with a model answer, an explanation of why it earns the marks and the mark scheme an examiner would use.

Question 1

1 mark

A tennis club wants to find out how satisfied its members are with the club.
The secretary suggests taking a sample of members stratified by whether they are satisfied or not satisfied with the club.

Explain why this is not possible.

Model answer

Stratification happens before sampling, so the club must know which group each member is in. It does not know whether a member is satisfied until it asks them, which is what the survey is for, so it cannot divide the members into these groups.

Explanation

Stratification is not a method of sampling: it is done before sampling, by dividing the population into groups using information that is already known for every member, such as age group or type of membership. A variable that the survey is measuring cannot be used to stratify.

Mark scheme
  1. 1 mark

    B1 for the club does not know which members are satisfied until it has asked them (this is what the survey is trying to find out), so it cannot put the members into these groups before taking the sample

    oe. Accept 'there is no list of which members are satisfied and which are not'. 'The groups may be different sizes' B0. 'It would be biased' or 'it is not fair' with no explanation B0.
Question 2

2 marks

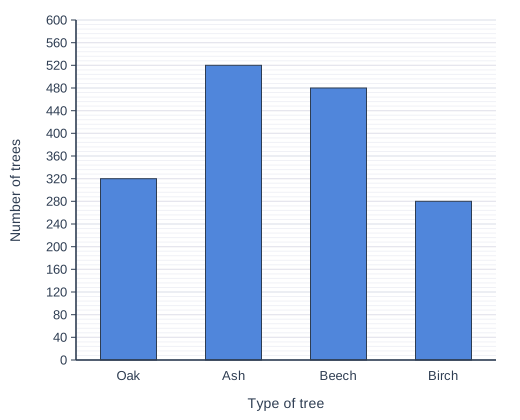
The bar chart shows the numbers of trees of four types in a woodland.

A researcher measures the heights of a sample of 80 of these trees, stratified by type of tree.

Work out the number of birch trees in the sample.

Bar chart of number of trees for each type of tree: Oak 320, Ash 520, Beech 480, Birch 280.

Model answer

Total number of trees \(= 320 + 520 + 480 + 280 = 1600\)
Number of birch trees in the sample \(= \dfrac{280}{1600} \times 80 = 14\)

Explanation

Read every bar to find the total number of trees, then take the same fraction of the sample as the type of tree is of the woodland. Here the sample is \(\dfrac{80}{1600} = \dfrac{1}{20}\) of the trees, so each type's number is divided by 20. An equal split of 20 of each type is a common error.

Mark scheme
  1. 1 mark

    M1 for \(\dfrac{280}{1600} \times 80\) oe

    oe, eg \(280 \div 20\). The total \(320 + 520 + 480 + 280 = 1600\) may be implied. ft a misread bar if their total is the sum of their four readings (all four bars are on grid lines).

  2. 1 mark

    A1 for 14

    Correct answer with no working scores M1A1. 20 (an equal split) M0A0.

Question 3

3 marks

A garden centre has 1000 customers in its loyalty scheme. It takes a sample of 50 of these customers, stratified by age group. The number from each age group is rounded to the nearest whole number.
The sample contains 13 customers aged under 30.

Work out the least possible number and the greatest possible number of customers in the loyalty scheme who are aged under 30.

Model answer

The number in the sample is \(\dfrac{n}{1000} \times 50 = \dfrac{n}{20}\), and this rounds to 13.
So \(12.5 \le \dfrac{n}{20} < 13.5\), which gives \(250 \le n < 270\).
Least possible number \(= 250\)
Greatest possible number \(= 269\) (270 would give 13.5, which rounds to 14).

Explanation

Working backwards from a stratified sample gives only a range of possible population sizes, because each stratum was rounded. Find the values of the exact share that round to 13, from 12.5 up to (but not including) 13.5, and convert them back to customers. A common error is to give only \(13 \times 20 = 260\).

Mark scheme
  1. 1 mark

    M1 for \(12.5 \times 20\) or \(13.5 \times 20\) seen, or \(12.5 \le \dfrac{n}{1000} \times 50 < 13.5\) oe

    oe. Accept \(\dfrac{n}{20}\) for \(\dfrac{n}{1000} \times 50\).

  2. 1 mark

    A1 for least 250

    \(\dfrac{250}{1000} \times 50 = 12.5\), which rounds to 13.

  3. 1 mark

    A1 for greatest 269

    Dependent on the M1. 270 gives \(\dfrac{270}{1000} \times 50 = 13.5\), which rounds to 14, so 270 is not possible: 250 and 270 scores M1A1A0. 260 only (\(13 \times 20\)) scores M0A0A0. Correct answers with no working score full marks.

Question 4

4 marks

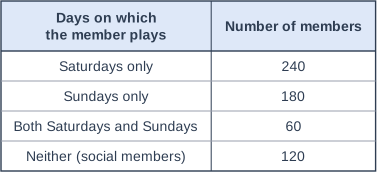
A sports club has 600 members. The table shows the days on which members play matches for the club.

The club wants a sample of 50 members, stratified by the days on which they play.
The secretary first suggests using two strata: 'members who play on Saturdays' and 'members who play on Sundays'.

Give two reasons why these two groups cannot be used as the strata.
Using the four groups in the table as the strata, work out the number of members who play on both Saturdays and Sundays in the sample.

Table with columns "Days on which the member plays", "Number of members". Days on which the member plays: Saturdays only; Number of members: 240 | Days on which the member plays: Sundays only; Number of members: 180 | Days on which the member plays: Both Saturdays and Sundays; Number of members: 60 | Days on which the member plays: Neither (social members); Number of members: 120.

Model answer

Reason 1: the groups overlap. The 60 members who play on both days would be in both strata, so they would be counted twice.
Reason 2: the 120 social members play on neither day, so they would not be in any stratum and could never be chosen.
Using the four groups: number who play on both days in the sample \(= \dfrac{60}{600} \times 50 = 5\)

Explanation

Strata must not overlap, and together they must include every member of the population, so that each member is in exactly one stratum. The four groups in the table do this: 240 + 180 + 60 + 120 = 600. The sample is then Saturdays only 20, Sundays only 15, both days 5 and social members 10.

Mark scheme
  1. 1 mark

    B1 for the two groups overlap: the 60 members who play on both days would be in both strata (so they could be chosen twice, or counted twice)

    oe. Accept 'some members are in both groups'.

  2. 1 mark

    B1 for the 120 social members, who play on neither day, are in neither group, so they could not be chosen (the strata must include every member)

    oe. The two reasons must be different. 'The groups are different sizes' B0 (this is not a problem for stratification).

  3. 1 mark

    M1 for \(\dfrac{60}{600} \times 50\) oe

    oe

  4. 1 mark

    A1 for 5

    Correct answer with no working scores M1A1. \(\dfrac{300}{600} \times 50 = 25\) (everyone who plays on Saturdays) M0A0.

Ready to try the rest? Every answer you write is marked against the mark scheme, so you can see exactly where the marks are.

Study Helper Hints first, answers after you try

Stuck on this one? Ask for a hint and I’ll point you in the right direction, without giving the answer away. Once you’ve checked your answer, I’ll show you how the marks are awarded.