
Level:
Correct: 0
Incorrect: 0
Marks: 0/0
Exam Practice
Course:
Topics:
AQA GCSE Statistics (Higher Paper 2) Smart practice A mixed round aimed at your weak spots
Unit 1
Planning and collecting data
Unit 2
Representing data
Section C: C1a (tabulation, tally, pictogram); Section E: E3d
Tabulation, tallies, pictograms and tables of data
Section C: C1a (pie chart), C1b (comparative pie chart)
Pie charts and comparative pie charts
Section C: C1a (stem and leaf diagram)
Stem and leaf diagrams
Section C: C2 (bar charts, bar line charts, line charts, frequency polygons)
Bar charts, line charts and frequency polygons
Section C: C2 (cumulative frequency charts)
Cumulative frequency diagrams
Section C: C2 (histograms), C3b
Histograms and frequency density
Section C: C2 (box plots); Section D: D3b; Section E: E5b
Box plots and outliers
Unit 3
Summarising data
Section D: D1a (mode, median, arithmetic mean)
Mode, median and mean
Section D: D1a (weighted mean, geometric mean), D1b
Weighted mean, geometric mean and choosing an average
Section D: D2; Section E: E5a
Skewness
Section D: D3a (range, quartiles, IQR, percentiles, interpercentile and interdecile range)
Range, quartiles, percentiles and interdecile range
Section D: D3a (standard deviation)
Standard deviation
Section C: C2 (time series); Section D: D1a (mean seasonal variation), D4; Section E: E6
Time series, moving averages and seasonal variation
Section C: C2 (scatter charts); Section D: D5
Scatter diagrams, lines of best fit and regression lines
Section D: D6; Section E: E9a, E9b, E9c
Spearman's rank correlation coefficient
Unit 4
Probability
Unit 5
Interpreting and evaluating results
Unit 6
Statistical enquiry cycle
3.6 Statistical enquiry cycle: 3.6.1 Initial planning, 3.6.2 Data collection
Statistical enquiry cycle: planning and data collection
3.6 Statistical enquiry cycle: 3.6.3 Processing and presentation, 3.6.4 Interpretation, 3.6.5 Evaluation
Statistical enquiry cycle: analysis and evaluation
Avg
score:
–
Topics
done:
0/39

Independent events and conditional probability

Practise 16 exam-style questions on Independent events and conditional probability for AQA GCSE Statistics (Higher Paper 2). Write your answer as you would in the exam and get it marked in seconds against the mark scheme, point by point, with the Study Helper on hand if you get stuck.

  • 16 questions
  • 1–5 marks each
  • Instant marking
  • No sign-up needed
16 questions, marked as you go

Sample questions with model answers

Here are 4 of the questions in this topic, each with a model answer, an explanation of why it earns the marks and the mark scheme an examiner would use.

Question 1

1 mark

At a garage, a car is chosen at random.
T is the event 'the car needs new tyres'.
R is the event 'the car is red'.

\(P(T \mid R) = P(T)\)

What does this tell you? Give your answer in context.

Model answer

The probability that a car needs new tyres is the same whether or not you know it is red: needing new tyres is independent of the car being red.

Explanation

\(P(T \mid R)\) is the probability that a car needs new tyres given that it is red. If this equals \(P(T)\), being red makes no difference to the probability, which is what it means for T and R to be independent. In context: red cars are no more and no less likely to need new tyres than cars in general.

Mark scheme
  1. 1 mark

    B1 for knowing that a car is red does not change the probability that it needs new tyres / whether a car needs new tyres is independent of whether it is red

    oe, eg 'red cars are just as likely to need new tyres as any car at the garage', 'T and R are independent: the colour red makes no difference to needing tyres'. Must be in context (tyres and red cars). 'T and R are independent' with no context scores B0. Do not accept 'red cars need new tyres' or 'the probability that a car is red and needs tyres is P(T)'. Ignore any non-contradictory or irrelevant statements.
Question 2

2 marks

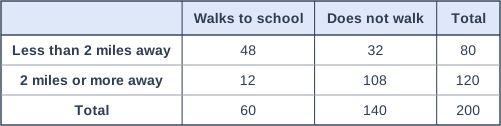
The table shows information about 200 students at a school.

A student is chosen at random.
L is the event 'the student lives less than 2 miles from school'.
W is the event 'the student walks to school'.

Kim says, "\(P(W \mid L) = P(L \mid W)\)"

Show that Kim is wrong.

Table with columns (row headings), "Walks to school", "Does not walk", "Total". Less than 2 miles away; Walks to school: 48; Does not walk: 32; Total: 80 | 2 miles or more away; Walks to school: 12; Does not walk: 108; Total: 120 | Total; Walks to school: 60; Does not walk: 140; Total: 200.

Model answer

\(P(W \mid L)\): of the 80 students who live less than 2 miles away, 48 walk: \(\dfrac{48}{80} = 0.6\)
\(P(L \mid W)\): of the 60 students who walk, 48 live less than 2 miles away: \(\dfrac{48}{60} = 0.8\)
0.6 is not equal to 0.8, so Kim is wrong.

Explanation

Both probabilities have the same numerator (the 48 students in both groups) but different denominators: \(P(W \mid L)\) divides by the 80 students who live nearby, and \(P(L \mid W)\) divides by the 60 who walk. So swapping the condition usually changes the probability. In context: 60% of nearby students walk, but 80% of walkers live nearby.

Mark scheme
  1. 1 mark

    B1 for \(P(W \mid L) = \dfrac{48}{80}\) oe

    oe, eg 0.6, 60%. A probability written only as a ratio (48 : 80) or in words (48 out of 80) is not an acceptable form: if one or both of the two probabilities are given only in this way, the answer scores at most 1 mark in total (eg '48 out of 80 and 48 out of 60, so they are not equal' scores B1B0).

  2. 1 mark

    B1 for \(P(L \mid W) = \dfrac{48}{60}\) oe, and a statement that the two are not equal

    oe, eg 0.8, 80%. The conclusion may be implied, eg '0.6 and 0.8, so Kim is wrong'. \(\dfrac{48}{200}\) for either probability scores B0 for that mark (it is \(P(L \cap W)\)). Any values stated must be correct.

Question 3

3 marks

A person who owns a smartphone is chosen at random.
T is the event 'the person owns a tablet'.
W is the event 'the person owns a smartwatch'.

\(P(T) = 0.35\)   \(P(W) = 0.5\)   \(P(W \mid T) = 0.4\)

Work out \(P(T \mid W)\).

Model answer

\(P(T \cap W) = P(T) \times P(W \mid T) = 0.35 \times 0.4 = 0.14\)
\(P(T \mid W) = \dfrac{P(T \cap W)}{P(W)} = \dfrac{0.14}{0.5} = 0.28\)

Explanation

Use the conditional probability formula twice: first rearrange \(P(W \mid T) = \dfrac{P(T \cap W)}{P(T)}\) to find \(P(T \cap W)\), then divide by P(W). In context, 40% of tablet owners own a smartwatch, but only 28% of smartwatch owners own a tablet, because more people own a smartwatch than a tablet.

Mark scheme
  1. 1 mark

    M1 for \(P(T \cap W) = 0.35 \times 0.4\) or 0.14

    oe, from \(P(W \mid T) = \dfrac{P(T \cap W)}{P(T)}\). May be seen on a tree diagram or Venn diagram.

  2. 1 mark

    M1dep for their \(0.14 \div 0.5\)

    oe, eg \(\dfrac{0.14}{0.5}\)

  3. 1 mark

    A1 for 0.28

    oe, eg 28%, \(\dfrac{7}{25}\). A percentage must have the % sign; an answer written as a ratio or in words scores M1M1A0. 0.4 (assuming \(P(T \mid W) = P(W \mid T)\)) scores 0. 0.35 (assuming independence) scores 0. \(0.4 \div 0.5 = 0.8\) scores M0M0A0. Correct answer with no working scores full marks.

Question 4

5 marks

An office building has two lifts. Over 250 working days:
- lift 1 broke down on 20 days
- lift 2 broke down on 25 days
- both lifts broke down on 10 of these days.

Raj assumes that the two lifts break down independently.
He says that the probability that both lifts break down on a day is 0.008

Show how Raj worked out 0.008
Use the data to explain why Raj's assumption is probably wrong.
Give a possible reason, in context, why the lifts may not break down independently.

Model answer

P(lift 1 breaks down) \(= \dfrac{20}{250} = 0.08\), P(lift 2 breaks down) \(= \dfrac{25}{250} = 0.1\)
If independent: P(both) \(= 0.08 \times 0.1 = 0.008\) - this is Raj's value.
From the data: P(both) \(= \dfrac{10}{250} = 0.04\), which is 5 times 0.008 (10 days instead of the 2 days expected if independent).
So the lifts break down together far more often than independence predicts: Raj's assumption is probably wrong.
A possible reason: the lifts share a power supply, so a power cut stops both of them on the same day.

Explanation

For independent events \(P(A \cap B) = P(A) \times P(B)\), which gives Raj's 0.008. Comparing this with the relative frequency of both breaking down (0.04) tests his assumption: the data show the lifts fail together 5 times as often as independence predicts. When two events share a cause - a power supply, heavy use on the same days - they are usually not independent.

Mark scheme
  1. 1 mark

    M1 for P(lift 1 breaks down) \(= \dfrac{20}{250}\) or 0.08, and P(lift 2 breaks down) \(= \dfrac{25}{250}\) or 0.1

    oe. Both needed.

  2. 1 mark

    A1 for \(0.08 \times 0.1 = 0.008\)

    oe, eg \(\dfrac{20}{250} \times \dfrac{25}{250} = \dfrac{500}{62\,500}\)

  3. 1 mark

    M1 for P(both break down) from the data \(= \dfrac{10}{250}\) or 0.04

    oe. Alternative: the expected number of days with both broken down if independent, \(0.008 \times 250 = 2\) days, compared with the actual 10 days.

  4. 1 mark

    A1 for a correct comparison, eg 0.04 is 5 times as big as 0.008 / both broke down on 10 days but only 2 would be expected if they were independent, so the breakdowns are not independent

    oe. Must compare the values and conclude that the breakdowns are (probably) not independent. Any values stated must be correct.

  5. 1 mark

    B1 for a possible reason in context, eg the lifts share the same power supply / they are both used more on busy days / when one lift breaks down, the other has to carry more people / they are serviced by the same engineer at the same time

    oe. Must be a reason that links the two lifts' breakdowns. Do not accept 'they are old' or 'they are badly made' unless it explains why they would break down on the same days. Ignore any non-contradictory or irrelevant statements.

Ready to try the rest? Every answer you write is marked against the mark scheme, so you can see exactly where the marks are.

Study Helper Hints first, answers after you try

Stuck on this one? Ask for a hint and I’ll point you in the right direction, without giving the answer away. Once you’ve checked your answer, I’ll show you how the marks are awarded.