
Level:
Correct: 0
Incorrect: 0
Marks: 0/0
Exam Practice
Course:
Topics:
AQA GCSE Statistics (Higher Paper 2) Smart practice A mixed round aimed at your weak spots
Unit 1
Planning and collecting data
Unit 2
Representing data
Section C: C1a (tabulation, tally, pictogram); Section E: E3d
Tabulation, tallies, pictograms and tables of data
Section C: C1a (pie chart), C1b (comparative pie chart)
Pie charts and comparative pie charts
Section C: C1a (stem and leaf diagram)
Stem and leaf diagrams
Section C: C2 (bar charts, bar line charts, line charts, frequency polygons)
Bar charts, line charts and frequency polygons
Section C: C2 (cumulative frequency charts)
Cumulative frequency diagrams
Section C: C2 (histograms), C3b
Histograms and frequency density
Section C: C2 (box plots); Section D: D3b; Section E: E5b
Box plots and outliers
Unit 3
Summarising data
Section D: D1a (mode, median, arithmetic mean)
Mode, median and mean
Section D: D1a (weighted mean, geometric mean), D1b
Weighted mean, geometric mean and choosing an average
Section D: D2; Section E: E5a
Skewness
Section D: D3a (range, quartiles, IQR, percentiles, interpercentile and interdecile range)
Range, quartiles, percentiles and interdecile range
Section D: D3a (standard deviation)
Standard deviation
Section C: C2 (time series); Section D: D1a (mean seasonal variation), D4; Section E: E6
Time series, moving averages and seasonal variation
Section C: C2 (scatter charts); Section D: D5
Scatter diagrams, lines of best fit and regression lines
Section D: D6; Section E: E9a, E9b, E9c
Spearman's rank correlation coefficient
Unit 4
Probability
Unit 5
Interpreting and evaluating results
Unit 6
Statistical enquiry cycle
3.6 Statistical enquiry cycle: 3.6.1 Initial planning, 3.6.2 Data collection
Statistical enquiry cycle: planning and data collection
3.6 Statistical enquiry cycle: 3.6.3 Processing and presentation, 3.6.4 Interpretation, 3.6.5 Evaluation
Statistical enquiry cycle: analysis and evaluation
Avg
score:
–
Topics
done:
0/39

Mode, median and mean

Practise 16 exam-style questions on Mode, median and mean for AQA GCSE Statistics (Higher Paper 2). Write your answer as you would in the exam and get it marked in seconds against the mark scheme, point by point, with the Study Helper on hand if you get stuck.

  • 16 questions
  • 1–5 marks each
  • Instant marking
  • No sign-up needed
16 questions, marked as you go

Sample questions with model answers

Here are 4 of the questions in this topic, each with a model answer, an explanation of why it earns the marks and the mark scheme an examiner would use.

Question 1

1 mark

The median of seven consecutive whole numbers is 23.

Write down the mean of the seven numbers.

Model answer

The seven numbers are 20, 21, 22, 23, 24, 25, 26.
Total = 161, so the mean = 161 ÷ 7 = 23
(The numbers are symmetrical about 23, so the mean equals the median.)

Explanation

For data spread symmetrically about the middle value, such as consecutive whole numbers, the mean and the median are equal. Writing the numbers out and finding their total is a quick check.

Mark scheme
  1. 1 mark

    B1 for 23

    The numbers are 20, 21, 22, 23, 24, 25, 26, which are spread evenly about 23, so the mean equals the median (161 ÷ 7 = 23). Correct answer with no working scores 1.
Question 2

2 marks

Holly recorded the times she took to run 1 km on six days.

4 min 35 s   5 min 10 s   3 min 55 s
4 min 50 s   5 min 25 s   4 min 17 s

Work out her mean time.
Give your answer in minutes and seconds.

Model answer

In seconds: 275, 310, 235, 290, 325, 257
Total = 1692 seconds
Mean = 1692 ÷ 6 = 282 seconds
282 seconds = 4 minutes 42 seconds (4 × 60 = 240, and 282 - 240 = 42)
Mean time = 4 min 42 s

Explanation

Times in minutes and seconds are not decimals, because there are 60 seconds in a minute, not 100. Convert every time to seconds (or minutes as fractions), find the mean, then convert back. A common error is to treat 4 min 35 s as 4.35 minutes.

Mark scheme
  1. 1 mark

    M1 for converting the times to seconds and adding (1692) or dividing by 6 (282), or for a correct method using minutes as fractions, eg total 28.2 minutes

    oe. The times in seconds are 275, 310, 235, 290, 325, 257. Treating the times as decimals (4.35 + 5.10 + 3.55 + ...) M0A0: this gives 4.486..., often written as '4 min 49 s'.

  2. 1 mark

    A1 for 4 min 42 s

    Correct answer with no working scores 2. 282 seconds or 4.7 minutes (not in minutes and seconds) M1A0.

Question 3

3 marks

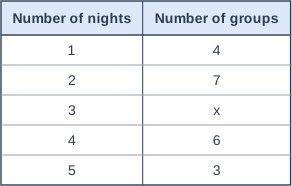
A campsite recorded the number of nights that each group of campers stayed.
The table shows the results.

The median number of nights is 3.

Work out the smallest possible value of \(x\).

Table with columns "Number of nights", "Number of groups". Number of nights: 1; Number of groups: 4 | Number of nights: 2; Number of groups: 7 | Number of nights: 3; Number of groups: x | Number of nights: 4; Number of groups: 6 | Number of nights: 5; Number of groups: 3.

Model answer

Total number of groups = 4 + 7 + x + 6 + 3 = 20 + x
11 groups stayed 1 or 2 nights, so the median is 3 only if the middle value(s) come after the 11th value.
x = 1: 21 groups, median = 11th value = 2. Not 3.
x = 2: 22 groups, median = mean of the 11th and 12th values = \(\dfrac{2 + 3}{2} = 2.5\). Not 3.
x = 3: 23 groups, median = 12th value = 3.
The smallest possible value of x is 3.

Explanation

The median depends on the position of the middle value, \(\dfrac{n + 1}{2}\), and n here depends on x. Count how many values come before 3 (11 of them) and test values of x. Watch the even case: with 22 groups the median is halfway between 2 and 3, so x = 2 is not enough.

Mark scheme
  1. 1 mark

    M1 for 4 + 7 = 11 groups stayed fewer than 3 nights, and the median position in terms of \(x\), eg \(\dfrac{20 + x + 1}{2}\), or a trial value of \(x\) with its median, eg \(x = 1\): 21 groups, median 2

    oe. The total number of groups is \(20 + x\).

  2. 1 mark

    M1dep for showing that \(x = 2\) does not work: 22 groups, so the median is halfway between the 11th value (2) and the 12th value (3), which is 2.5

    oe. Alternative: \(\dfrac{21 + x}{2} \ge 12\) (the median position must be at least the 12th value), giving \(x \ge 3\), scores M1M1. Common error: solving \(\dfrac{21 + x}{2} > 11\) to get \(x > 1\) and answering 2, which forgets that with an even number of groups the median is the mean of the two middle values: M1M0A0.

  3. 1 mark

    A1 for 3

    With \(x = 3\) there are 23 groups and the median is the 12th value, which is 3. Trial and improvement is a valid method: correct trials earn the method marks as described in the first two marks, even if the final answer is wrong. Correct answer with no working scores 3.

Question 4

4 marks

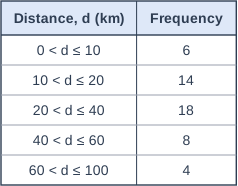
A county show asked 50 visitors how far, \(d\) km, they had travelled to the show.
The table shows the results.

Work out an estimate of the mean distance travelled.

The organiser says,
"Even without the exact distances, we can be sure that the mean distance travelled was more than 20 km."

Explain why the organiser is correct.

Table with columns "Distance, d (km)", "Frequency". Distance, d (km): 0 < d ≤ 10; Frequency: 6 | Distance, d (km): 10 < d ≤ 20; Frequency: 14 | Distance, d (km): 20 < d ≤ 40; Frequency: 18 | Distance, d (km): 40 < d ≤ 60; Frequency: 8 | Distance, d (km): 60 < d ≤ 100; Frequency: 4.

Model answer

Midpoints: 5, 15, 30, 50, 80
Products: 6 × 5 = 30, 14 × 15 = 210, 18 × 30 = 540, 8 × 50 = 400, 4 × 80 = 320
\(\sum fx = 1500\)
Estimated mean = 1500 ÷ 50 = 30 km
The estimate uses the midpoints, so on its own it does not prove the claim. But every distance is more than the lower boundary of its class, so the real total distance is more than
0 × 6 + 10 × 14 + 20 × 18 + 40 × 8 + 60 × 4 = 1060 km.
So the real mean is more than 1060 ÷ 50 = 21.2 km, which is more than 20 km. The organiser is correct.

Explanation

An estimated mean from grouped data uses the midpoints, so it could be too high or too low. To be sure about a claim, find the smallest (or largest) possible mean by using the lower (or upper) class boundaries: here even the smallest possible mean, 21.2 km, is more than 20 km. Using the estimate of 30 km alone does not show that the claim must be true.

Mark scheme
  1. 1 mark

    M1 for at least 3 correct products of midpoint × frequency (30, 210, 540, 400, 320) or \(\sum fx = 1500\)

    The midpoints are 5, 15, 30, 50 and 80. Their midpoints must be within their classes.

  2. 1 mark

    M1dep for their \(\sum fx \div 50\)

    Dividing by 5 (the number of classes) M1M0A0.

  3. 1 mark

    A1 for 30 (km)

    Correct estimate with no working scores M1M1A1.

  4. 1 mark

    B1 for using the lower class boundaries to find the smallest possible mean, \(\dfrac{0 \times 6 + 10 \times 14 + 20 \times 18 + 40 \times 8 + 60 \times 4}{50} = 21.2\), which is more than 20

    oe, eg 'every distance is more than the lower boundary of its class, so the total distance is more than 1060 km and the mean is more than 1060 ÷ 50 = 21.2 km'. The value 21.2 (or the total 1060) must be seen with the comparison with 20. 'The estimate, 30 km, is more than 20 km' B0: it is only an estimate, so it does not show that the real mean must be more than 20 km. Ignore any non-contradictory or irrelevant statements.

Ready to try the rest? Every answer you write is marked against the mark scheme, so you can see exactly where the marks are.

Study Helper Hints first, answers after you try

Stuck on this one? Ask for a hint and I’ll point you in the right direction, without giving the answer away. Once you’ve checked your answer, I’ll show you how the marks are awarded.