
Level:
Correct: 0
Incorrect: 0
Marks: 0/0
Exam Practice
Course:
Topics:
AQA GCSE Statistics (Higher Paper 2) Smart practice A mixed round aimed at your weak spots
Unit 1
Planning and collecting data
Unit 2
Representing data
Section C: C1a (tabulation, tally, pictogram); Section E: E3d
Tabulation, tallies, pictograms and tables of data
Section C: C1a (pie chart), C1b (comparative pie chart)
Pie charts and comparative pie charts
Section C: C1a (stem and leaf diagram)
Stem and leaf diagrams
Section C: C2 (bar charts, bar line charts, line charts, frequency polygons)
Bar charts, line charts and frequency polygons
Section C: C2 (cumulative frequency charts)
Cumulative frequency diagrams
Section C: C2 (histograms), C3b
Histograms and frequency density
Section C: C2 (box plots); Section D: D3b; Section E: E5b
Box plots and outliers
Unit 3
Summarising data
Section D: D1a (mode, median, arithmetic mean)
Mode, median and mean
Section D: D1a (weighted mean, geometric mean), D1b
Weighted mean, geometric mean and choosing an average
Section D: D2; Section E: E5a
Skewness
Section D: D3a (range, quartiles, IQR, percentiles, interpercentile and interdecile range)
Range, quartiles, percentiles and interdecile range
Section D: D3a (standard deviation)
Standard deviation
Section C: C2 (time series); Section D: D1a (mean seasonal variation), D4; Section E: E6
Time series, moving averages and seasonal variation
Section C: C2 (scatter charts); Section D: D5
Scatter diagrams, lines of best fit and regression lines
Section D: D6; Section E: E9a, E9b, E9c
Spearman's rank correlation coefficient
Unit 4
Probability
Unit 5
Interpreting and evaluating results
Unit 6
Statistical enquiry cycle
3.6 Statistical enquiry cycle: 3.6.1 Initial planning, 3.6.2 Data collection
Statistical enquiry cycle: planning and data collection
3.6 Statistical enquiry cycle: 3.6.3 Processing and presentation, 3.6.4 Interpretation, 3.6.5 Evaluation
Statistical enquiry cycle: analysis and evaluation
Avg
score:
–
Topics
done:
0/39

Population pyramids, choropleth maps and 2D and 3D charts

Practise 15 exam-style questions on Population pyramids, choropleth maps and 2D and 3D charts for AQA GCSE Statistics (Higher Paper 2). Write your answer as you would in the exam and get it marked in seconds against the mark scheme, point by point, with the Study Helper on hand if you get stuck.

  • 15 questions
  • 1–5 marks each
  • Instant marking
  • No sign-up needed
15 questions, marked as you go

Sample questions with model answers

Here are 4 of the questions in this topic, each with a model answer, an explanation of why it earns the marks and the mark scheme an examiner would use.

Question 1

1 mark

The population pyramid shows the percentage of the total population of Country K in each age group in 2025.
Very few people move into or out of Country K.

For both males and females, the bars get shorter from the 20-29 age group down to the 0-9 age group.

What does this suggest about the number of babies born in Country K each year over the last 30 years?
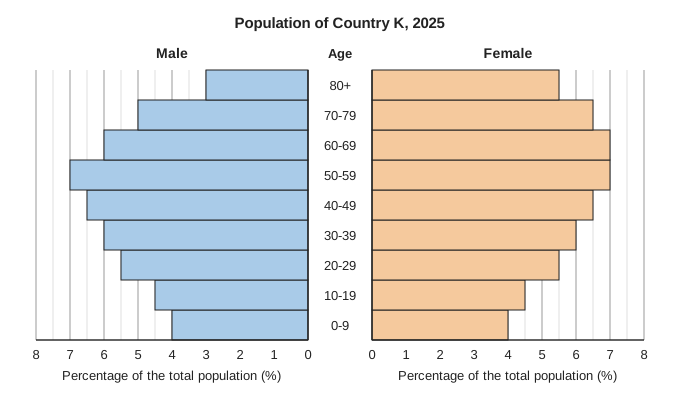
Population pyramid titled "Population of Country K, 2025". Male bars go to the left and female bars go to the right of a central column of age groups, youngest at the bottom: 0-9, 10-19, 20-29, 30-39, 40-49, 50-59, 60-69, 70-79, 80+. Each side has a scale labelled "Percentage of the total population (%)", numbered 0 to 8 from the centre outwards, with grid lines every 0.5. Every bar ends exactly on a grid line. Male bars from 0-9 up to 80+: 4, 4.5, 5.5, 6, 6.5, 7, 6, 5, 3. Female bars from 0-9 up to 80+: 4, 4.5, 5.5, 6, 6.5, 7, 7, 6.5, 5.5.

Model answer

The people aged 20-29 were born 20 to 30 years ago, the people aged 10-19 were born 10 to 20 years ago and the people aged 0-9 in the last 10 years. Each of these groups is smaller than the one before, and few people move in or out, so it suggests that the number of babies born each year in Country K has been falling over the last 30 years.

Explanation

Each age group in a pyramid is a group of people born in the same ten years, so a base that gets narrower towards the youngest group usually means that fewer babies are being born each year (a falling birth rate). Deaths at young ages are rare, and the question says migration is small, so births are the likely cause. Restating that there are fewer children does not answer the question.

Mark scheme
  1. 1 mark

    B1 for the number of babies born each year has been falling (fewer babies were born in recent years than 20 to 30 years ago)

    oe, eg 'the birth rate has gone down'; 'families are having fewer children than before'; 'fewer people were born in each ten-year period'. Must be about births decreasing over time. 'There are fewer children' (a restatement of the bars), 'more children are dying', 'the population is getting older' or 'more people are moving away' scores B0. Ignore any non-contradictory or irrelevant statements.
Question 2

2 marks

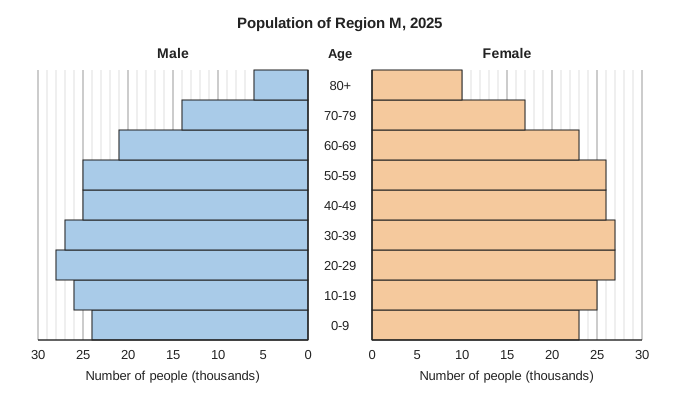
The population pyramid shows the number of people in each age group in Region M in 2025.

In the whole country, among the people aged 70 and over, there are 80 males for every 100 females.

Among the people aged 70 and over in Region M, are there more or fewer than 80 males for every 100 females?
You must show your working.

Population pyramid titled "Population of Region M, 2025". Male bars go to the left and female bars go to the right of a central column of age groups, youngest at the bottom: 0-9, 10-19, 20-29, 30-39, 40-49, 50-59, 60-69, 70-79, 80+. Each side has a scale labelled "Number of people (thousands)", numbered 0, 5, 10, 15, 20, 25, 30 from the centre outwards, with grid lines every 1. Every bar ends exactly on a grid line. Male bars from 0-9 up to 80+: 24, 26, 28, 27, 25, 25, 21, 14, 6. Female bars from 0-9 up to 80+: 23, 25, 27, 27, 26, 26, 23, 17, 10.

Model answer

Aged 70 and over in Region M:
males \(= 14 + 6 = 20\) thousand
females \(= 17 + 10 = 27\) thousand
Males for every 100 females \(= \dfrac{20}{27} \times 100 = 74.1\)

74.1 is less than 80, so among the over-70s in Region M there are fewer males for every 100 females than in the whole country.

Explanation

Add the 70-79 and 80+ bars for each sex, then compare the two totals as a ratio. Women live longer than men on average, so in the oldest age groups there are fewer males than females, and Region M has an even smaller share of men aged 70 and over than the country as a whole. Using only one age group, or turning the ratio upside down without comparing it correctly, are the common errors.

Mark scheme
  1. 1 mark

    M1 for \(\dfrac{14 + 6}{17 + 10}\) (\(\times 100\)) or 20 : 27

    oe, eg 20 thousand males and 27 thousand females aged 70 and over, or \(0.8 \times 27 = 21.6\) compared with 20. Both age groups (70-79 and 80+) are needed for both sexes. Allow one reading error of 1 thousand. Using only the 80+ bars (\(\dfrac{6}{10}\), 60 males per 100 females) or only the 70-79 bars (\(\dfrac{14}{17}\), 82.4) is not a correct method: M0. \(\dfrac{27}{20}\) (135 females for every 100 males) scores M1 only if it is then compared correctly, eg with \(\dfrac{100}{80} = 125\).

  2. 1 mark

    A1 for fewer, with 74(.07...) males for every 100 females

    Accept [74, 74.1], or 20 thousand males compared with 21.6 thousand (80% of the 27 thousand females), or 135 compared with 125 females for every 100 males. Every bar ends on a grid line, so the values must be correct for this mark. The decision may be implied, eg 'Region M has a lower proportion of men among its over-70s'. The question says 'You must show your working': fewer with no working scores 0.

Question 3

2 marks

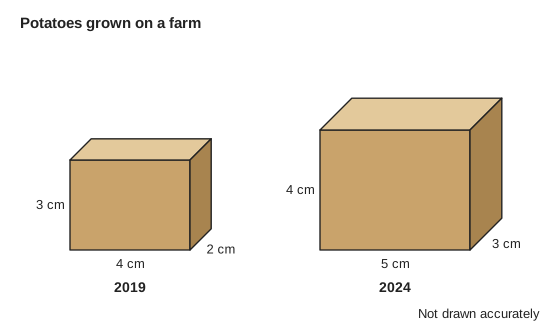
A farm's annual report uses two boxes to show the amounts of potatoes it grew in 2019 and in 2024.
The volume of each box is proportional to the amount of potatoes grown that year.
The diagram shows the boxes.

Work out the percentage increase in the amount of potatoes grown from 2019 to 2024.

Diagram titled "Potatoes grown on a farm" showing two boxes (cuboids) drawn in three dimensions, side by side. The smaller box on the left is labelled 4 cm wide, 3 cm high and 2 cm deep, with the caption 2019. The larger box on the right is labelled 5 cm wide, 4 cm high and 3 cm deep, with the caption 2024. The diagram is marked Not drawn accurately.

Model answer

Volume of the 2019 box \(= 4 \times 3 \times 2 = 24\) cm³
Volume of the 2024 box \(= 5 \times 4 \times 3 = 60\) cm³
The 2024 amount is \(\dfrac{60}{24} = 2.5\) times the 2019 amount.
Percentage increase \(= \dfrac{60 - 24}{24} \times 100 = 150\%\)

Explanation

When volumes represent amounts, compare the volumes, not one length or the area of one face. The 2024 box has 2.5 times the volume of the 2019 box, so the amount grew by 150%. Comparing only the heights (33.3%) or the front faces (66.7%), or giving 250% for the increase, are the common errors.

Mark scheme
  1. 1 mark

    M1 for \(\dfrac{5 \times 4 \times 3}{4 \times 3 \times 2}\) or \(\dfrac{60}{24}\) or 2.5, or \(\dfrac{60 - 24}{24}\) (\(\times 100\))

    oe, eg volumes 24 cm³ and 60 cm³ seen.

  2. 1 mark

    A1 for 150(%)

    Correct answer with no working scores 2 marks. 250% (the 2024 amount as a percentage of the 2019 amount, not the increase) scores M1A0. Using the heights only (\(\dfrac{4}{3}\), an increase of 33.3%) or the areas of the front faces (\(\dfrac{20}{12}\), an increase of 66.7%) scores M0A0.

Question 4

4 marks

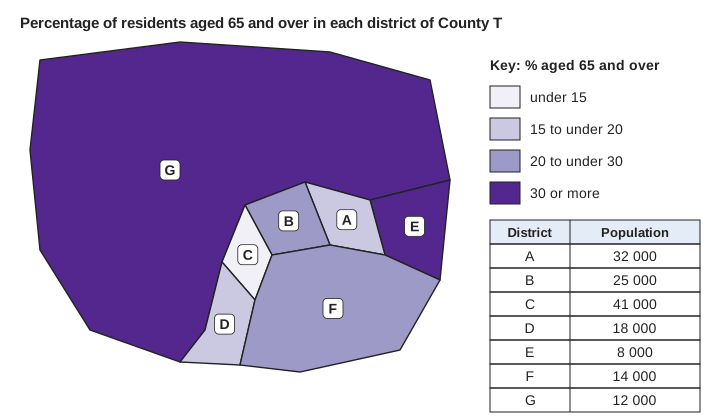
The choropleth map shows the percentage of residents aged 65 and over in each district of County T.
The table on the map gives the population of each district.

Jo says,
"Most of the people in County T live in districts where 30% or more of the residents are aged 65 and over, because most of the map is the darkest colour."

Is Jo correct?
You must show your working.

Choropleth map titled "Percentage of residents aged 65 and over in each district of County T", made of 7 districts labelled A to G. District G is by far the largest district: it covers the whole north and west of the county and most of the map. Districts A to F are small districts in the south-east: E on the eastern edge, A, B and C in a row to the west of E, D in the south-west of this group and F along the south-eastern edge. The key, "Key: % aged 65 and over", has four shades of purple from lightest to darkest: under 15; 15 to under 20; 20 to under 30; 30 or more. Shading: G and E darkest (30 or more); B and F 20 to under 30; A and D 15 to under 20; C lightest (under 15). A table beside the map, with columns District and Population, gives A 32 000, B 25 000, C 41 000, D 18 000, E 8 000, F 14 000, G 12 000.

Model answer

Districts in the darkest class (30% or more): E and G.
People living in E and G \(= 8000 + 12\,000 = 20\,000\)
Total population \(= 32\,000 + 25\,000 + 41\,000 + 18\,000 + 8000 + 14\,000 + 12\,000 = 150\,000\)
Percentage \(= \dfrac{20\,000}{150\,000} \times 100 = 13.3\%\)

No, Jo is not correct. Only 13.3% of the people live in these districts. Most of the map is dark because District G is very large, but few people live there: the area of a district does not show how many people live in it.

Explanation

A choropleth map gives an impression by area, but large rural areas often have few people. To find how many people live in the darkest districts, use the populations in the table, not the area of the map. Here the darkest districts cover most of the map but hold only 20 000 of the 150 000 residents.

Mark scheme
  1. 1 mark

    M1 for \(8000 + 12\,000\) or 20 000 (the population of Districts E and G)

    E and G are the only districts in the class 30% or more.

  2. 1 mark

    M1 for their 20 000 compared with half of 150 000 (75 000), or \(\dfrac{\text{their } 20\,000}{150\,000}\) (\(\times 100\))

    The total population is 32 000 + 25 000 + 41 000 + 18 000 + 8000 + 14 000 + 12 000 = 150 000. Also award for 130 000 people living in the other districts.

  3. 1 mark

    A1 for No, with 13.3% (or 20 000 out of 150 000, or 20 000 < 75 000)

    Accept [13.3, 13.34] or \(\dfrac{2}{15}\). The decision may be implied. The question says 'You must show your working': No with no working scores M0M0A0 (the B1 can still be scored).

  4. 1 mark

    B1 for the size of a district on the map does not show how many people live there, eg District G covers most of the map but has only 12 000 people

    oe, eg 'G is a large area with few people'; 'the map shows area, not population'. Must refer to area (size on the map) compared with population. Ignore any non-contradictory or irrelevant statements.
Ready to try the rest? Every answer you write is marked against the mark scheme, so you can see exactly where the marks are.

Study Helper Hints first, answers after you try

Stuck on this one? Ask for a hint and I’ll point you in the right direction, without giving the answer away. Once you’ve checked your answer, I’ll show you how the marks are awarded.