
Level:
Correct: 0
Incorrect: 0
Marks: 0/0
Exam Practice
Course:
Topics:
AQA GCSE Statistics (Higher Paper 2) Smart practice A mixed round aimed at your weak spots
Unit 1
Planning and collecting data
Unit 2
Representing data
Section C: C1a (tabulation, tally, pictogram); Section E: E3d
Tabulation, tallies, pictograms and tables of data
Section C: C1a (pie chart), C1b (comparative pie chart)
Pie charts and comparative pie charts
Section C: C1a (stem and leaf diagram)
Stem and leaf diagrams
Section C: C2 (bar charts, bar line charts, line charts, frequency polygons)
Bar charts, line charts and frequency polygons
Section C: C2 (cumulative frequency charts)
Cumulative frequency diagrams
Section C: C2 (histograms), C3b
Histograms and frequency density
Section C: C2 (box plots); Section D: D3b; Section E: E5b
Box plots and outliers
Unit 3
Summarising data
Section D: D1a (mode, median, arithmetic mean)
Mode, median and mean
Section D: D1a (weighted mean, geometric mean), D1b
Weighted mean, geometric mean and choosing an average
Section D: D2; Section E: E5a
Skewness
Section D: D3a (range, quartiles, IQR, percentiles, interpercentile and interdecile range)
Range, quartiles, percentiles and interdecile range
Section D: D3a (standard deviation)
Standard deviation
Section C: C2 (time series); Section D: D1a (mean seasonal variation), D4; Section E: E6
Time series, moving averages and seasonal variation
Section C: C2 (scatter charts); Section D: D5
Scatter diagrams, lines of best fit and regression lines
Section D: D6; Section E: E9a, E9b, E9c
Spearman's rank correlation coefficient
Unit 4
Probability
Unit 5
Interpreting and evaluating results
Unit 6
Statistical enquiry cycle
3.6 Statistical enquiry cycle: 3.6.1 Initial planning, 3.6.2 Data collection
Statistical enquiry cycle: planning and data collection
3.6 Statistical enquiry cycle: 3.6.3 Processing and presentation, 3.6.4 Interpretation, 3.6.5 Evaluation
Statistical enquiry cycle: analysis and evaluation
Avg
score:
–
Topics
done:
0/39

Problems with data, cleaning data and control groups

Practise 15 exam-style questions on Problems with data, cleaning data and control groups for AQA GCSE Statistics (Higher Paper 2). Write your answer as you would in the exam and get it marked in seconds against the mark scheme, point by point, with the Study Helper on hand if you get stuck.

  • 15 questions
  • 1–5 marks each
  • Instant marking
  • No sign-up needed
15 questions, marked as you go

Sample questions with model answers

Here are 4 of the questions in this topic, each with a model answer, an explanation of why it earns the marks and the mark scheme an examiner would use.

Question 1

1 mark

A report on a survey of 200 workers says,
'46% walk to work, 31% drive to work and 27% go to work by bus.'
These percentages add up to 104%.

Give a possible reason, other than a calculation error, why the percentages add up to more than 100%.

Model answer

Some workers may use more than one way of getting to work, for example walking to a bus stop and then catching the bus. If the survey let people choose more than one answer, these workers are counted twice, so the percentages add up to more than 100%.

Explanation

Percentages of a whole add up to 100% only when every person is in exactly one category. When people can give more than one answer, the total can be more than 100%, and the report should say so. Rounding can only change the total by a small amount, which is a useful check.

Mark scheme
  1. 1 mark

    B1 for some workers use more than one way of getting to work (eg walk to the bus stop and then take the bus, or drive on some days and walk on others), so the survey allowed more than one answer and some workers are counted in more than one group

    oe. Accept 'people could tick more than one box'. 'Rounding' B0: each of three percentages rounded to the nearest whole number is at most 0.5 too big, so their total can be at most 101%, and rounding cannot explain 104%. 'Some people did not answer' B0 (that would make the total less than 100%).
Question 2

2 marks

A hair salon asked its customers to rate its service. Customers could fill in a paper card in the salon or an online form.

Paper card: 1 = very poor, 2 = poor, 3 = average, 4 = good, 5 = very good
Online form: 1 = very good, 2 = good, 3 = average, 4 = poor, 5 = very poor

The manager typed all the ratings into one column of a spreadsheet and worked out their mean.

Explain why the manager's mean rating does not show how satisfied the customers are.
Describe how the online ratings should be cleaned before the mean is worked out.

Model answer

On the paper card a high number means a good rating, but on the online form a high number means a poor rating. The same number means opposite things, so when the two sets of ratings are put together, a customer who was very satisfied online (1) pulls the mean down as if they were very unhappy. The mean of the mixed column does not show how satisfied the customers are.
Before the mean is worked out, the online ratings should be changed to the paper-card scale: 1 becomes 5, 2 becomes 4, 3 stays as 3, 4 becomes 2 and 5 becomes 1 (each online rating \(r\) becomes \(6 - r\)). Then every rating means the same thing, and the mean can be worked out.

Explanation

Data collected in different ways must be in the same format before they are combined. Here the two forms code the same answers with opposite numbers, so the online ratings must be recoded onto the paper-card scale. Deleting one set of ratings would throw away good data, and averaging the mixed column treats opposite opinions as the same.

Mark scheme
  1. 1 mark

    B1 for explaining that the two forms use the numbers in opposite directions, so the same number means opposite things (eg 1 is very poor on a paper card but very good online); putting the ratings together mixes good and poor opinions, so the mean is meaningless (eg very satisfied online customers pull the mean down)

    oe. Must refer to the scales being reversed, or to the numbers meaning different things on the two forms. Do not accept 'the online ratings are wrong', 'some customers lied' or 'the mean is the wrong average' with no reference to the scales. The two marks are independent.

  2. 1 mark

    B1 for changing each online rating to the paper-card scale before combining: 1 becomes 5, 2 becomes 4, 3 stays as 3, 4 becomes 2 and 5 becomes 1 (each online rating \(r\) becomes \(6 - r\))

    oe. Accept reversing the paper-card ratings instead, so that all the ratings use the online scale. Accept 'work out the mean of each form separately, change the online mean \(m\) to \(6 - m\), and combine the two means weighted by the numbers of ratings'. Do not accept 'delete the online ratings' (good data would be lost), 'use only one type of form next time' (this does not clean these data) or 'change 1 to 5' with no other values changed.

Question 3

3 marks

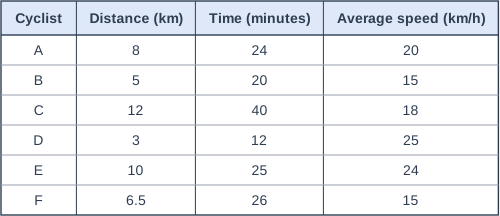
Six cyclists recorded the distance and the time of their ride to work one day, and an app recorded their average speed. The table shows the records.

For one cyclist, the distance, the time and the average speed do not fit together.

Identify this cyclist and show how you know.
Explain why this cyclist's record cannot be corrected using only the table, and give one possible correction to this cyclist's record.

Table with columns "Cyclist", "Distance (km)", "Time (minutes)", "Average speed (km/h)". Cyclist: A; Distance (km): 8; Time (minutes): 24; Average speed (km/h): 20 | Cyclist: B; Distance (km): 5; Time (minutes): 20; Average speed (km/h): 15 | Cyclist: C; Distance (km): 12; Time (minutes): 40; Average speed (km/h): 18 | Cyclist: D; Distance (km): 3; Time (minutes): 12; Average speed (km/h): 25 | Cyclist: E; Distance (km): 10; Time (minutes): 25; Average speed (km/h): 24 | Cyclist: F; Distance (km): 6.5; Time (minutes): 26; Average speed (km/h): 15.

Model answer

Check each record with speed \(= \text{distance} \div \text{time in hours}\). For cyclist A, \(8 \div \dfrac{24}{60} = 20\) km/h, which agrees. For cyclist D, \(3 \div \dfrac{12}{60} = 15\) km/h, but the table says 25 km/h. So cyclist D's record is inconsistent.
Any one of D's three values could have been recorded wrongly, and the table does not show which one. For example:
- if the distance and time are right, the speed should be 15 km/h;
- if the distance and speed are right, the time should be \(3 \div 25 \times 60 = 7.2\) minutes;
- if the time and speed are right, the distance should be \(25 \times \dfrac{12}{60} = 5\) km.
The original records should be checked before the data are used.

Explanation

Values that are linked by a formula can be checked against each other to find recording errors. Finding the inconsistent record is not the same as knowing which value is wrong, so the correction must come from the original data or the person who recorded it; if it cannot be checked, the record may have to be left out.

Mark scheme
  1. 1 mark

    B1 for cyclist D, because 3 km in 12 minutes is an average speed of \(3 \div \dfrac{12}{60} = 15\) km/h, not 25 km/h

    oe. A check of D's values must be seen. Accept '3 km at 25 km/h would take 7.2 minutes, not 12'.

  2. 1 mark

    B1 for any one of the three values could be the wrong one, and the table does not show which, so the original records (or the cyclist) should be checked

    oe

  3. 1 mark

    B1 for a correct possible correction: speed 15 km/h / time 7.2 minutes / distance 5 km

    Any one of these. The correction must keep the other two values of D's record unchanged. If more than one correction is given, each one must be correct.

Question 4

5 marks

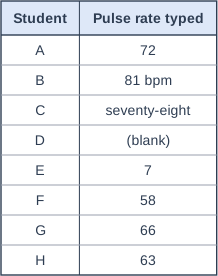
After a lesson about the heart, 8 students in a PE class each measured their own resting pulse rate, in beats per minute, and typed it into an online form. The table shows what they typed.

Describe three different problems with the data, and say how each problem should be dealt with.
Then work out the median pulse rate of the students whose values can be used after the data have been cleaned.

Table with columns "Student", "Pulse rate typed". Student: A; Pulse rate typed: 72 | Student: B; Pulse rate typed: 81 bpm | Student: C; Pulse rate typed: seventy-eight | Student: D; Pulse rate typed: (blank) | Student: E; Pulse rate typed: 7 | Student: F; Pulse rate typed: 58 | Student: G; Pulse rate typed: 66 | Student: H; Pulse rate typed: 63.

Model answer

Problem 1: B typed '81 bpm'. The units are extra text, so a spreadsheet would treat the entry as text, not as a number. Remove 'bpm' and record 81.
Problem 2: C typed the value in words, 'seventy-eight'. Change it to the number 78.
Problem 3: D's value is missing. Leave D out of the calculation (do not treat it as 0), or ask D to measure it again.
(Also: E's value, 7, is impossible for a resting pulse rate, so check it with E and leave it out if it cannot be corrected - do not guess what E meant.)
Usable values in order: 58, 63, 66, 72, 78, 81
There are 6 values, so the median is halfway between the 3rd and 4th: \(\dfrac{66 + 72}{2} = 69\)
Median pulse rate = 69 beats per minute

Explanation

Before processing, data must be numbers in one consistent format, with no extra text or symbols, and missing or impossible values must be dealt with (left out or checked, never replaced by 0 or by a guess). Here cleaning leaves 6 usable values, so the median is the mean of the middle two. Leaving out entries that can be cleaned, such as B's and C's, throws away good data and changes the answer.

Mark scheme
  1. 3 marks

    B3 for three different problems, each with a correct way of dealing with it (B1 for each), from:
    - B's entry '81 bpm' includes the units as text, so a spreadsheet would not treat it as a number: remove 'bpm' and record 81
    - C's entry is written in words: change 'seventy-eight' to the number 78
    - D's value is missing: leave D out of the calculation (do not use 0), or ask D to measure it again
    - E's value of 7 is impossible for a resting pulse rate (far lower than any healthy person's): check it with E or measure it again, and leave it out if it cannot be corrected (do not guess a value)

    1 mark for each different problem with a suitable way of dealing with it, max 3. A problem with no way of dealing with it scores B0 for that problem. Treating the missing value as 0 B0. Guessing a value for E (eg 70 or 77) B0 for that problem. 'E's value is an outlier' with no reference to it being impossible: B0 for that problem.

  2. 1 mark

    M1 for the six usable values in order, 58, 63, 66, 72, 78, 81, or the median as the mean of the 3rd and 4th of these

    The values for B and C must be the cleaned values, 81 and 78. Including E's 7 or a 0 for D gives a median of 66, including both gives 64.5, and leaving out B and C instead of cleaning them gives 64.5: each scores M0A0. A guessed value for E (eg 70, giving 70) M0A0.

  3. 1 mark

    A1 for 69 (beats per minute)

    Correct answer with no working scores M1A1 (the B3 marks still need the problems to be described).

Ready to try the rest? Every answer you write is marked against the mark scheme, so you can see exactly where the marks are.

Study Helper Hints first, answers after you try

Stuck on this one? Ask for a hint and I’ll point you in the right direction, without giving the answer away. Once you’ve checked your answer, I’ll show you how the marks are awarded.