
Level:
Correct: 0
Incorrect: 0
Marks: 0/0
Exam Practice
Course:
Topics:
AQA GCSE Statistics (Higher Paper 2) Smart practice A mixed round aimed at your weak spots
Unit 1
Planning and collecting data
Unit 2
Representing data
Section C: C1a (tabulation, tally, pictogram); Section E: E3d
Tabulation, tallies, pictograms and tables of data
Section C: C1a (pie chart), C1b (comparative pie chart)
Pie charts and comparative pie charts
Section C: C1a (stem and leaf diagram)
Stem and leaf diagrams
Section C: C2 (bar charts, bar line charts, line charts, frequency polygons)
Bar charts, line charts and frequency polygons
Section C: C2 (cumulative frequency charts)
Cumulative frequency diagrams
Section C: C2 (histograms), C3b
Histograms and frequency density
Section C: C2 (box plots); Section D: D3b; Section E: E5b
Box plots and outliers
Unit 3
Summarising data
Section D: D1a (mode, median, arithmetic mean)
Mode, median and mean
Section D: D1a (weighted mean, geometric mean), D1b
Weighted mean, geometric mean and choosing an average
Section D: D2; Section E: E5a
Skewness
Section D: D3a (range, quartiles, IQR, percentiles, interpercentile and interdecile range)
Range, quartiles, percentiles and interdecile range
Section D: D3a (standard deviation)
Standard deviation
Section C: C2 (time series); Section D: D1a (mean seasonal variation), D4; Section E: E6
Time series, moving averages and seasonal variation
Section C: C2 (scatter charts); Section D: D5
Scatter diagrams, lines of best fit and regression lines
Section D: D6; Section E: E9a, E9b, E9c
Spearman's rank correlation coefficient
Unit 4
Probability
Unit 5
Interpreting and evaluating results
Unit 6
Statistical enquiry cycle
3.6 Statistical enquiry cycle: 3.6.1 Initial planning, 3.6.2 Data collection
Statistical enquiry cycle: planning and data collection
3.6 Statistical enquiry cycle: 3.6.3 Processing and presentation, 3.6.4 Interpretation, 3.6.5 Evaluation
Statistical enquiry cycle: analysis and evaluation
Avg
score:
–
Topics
done:
0/39

Random, systematic and quota sampling

Practise 15 exam-style questions on Random, systematic and quota sampling for AQA GCSE Statistics (Higher Paper 2). Write your answer as you would in the exam and get it marked in seconds against the mark scheme, point by point, with the Study Helper on hand if you get stuck.

  • 15 questions
  • 1–6 marks each
  • Instant marking
  • No sign-up needed
15 questions, marked as you go

Sample questions with model answers

Here are 4 of the questions in this topic, each with a model answer, an explanation of why it earns the marks and the mark scheme an examiner would use.

Question 1

1 mark

Hassan wants a simple random sample of 40 of the 680 members of a gym. He numbers the members from 1 to 680.
He uses the random integer function on his calculator to generate whole numbers from 1 to 680.

Explain why he may need to generate more than 40 numbers to get 40 different members.

Model answer

The calculator can give the same number more than once. A member cannot be in the sample twice, so Hassan ignores any repeated number and keeps generating numbers until he has 40 different numbers.

Explanation

Each number from 1 to 680 is equally likely every time, so repeats can happen. In a simple random sample a member is chosen at most once, so repeats are ignored. Here no number can be out of range, because the function only gives 1 to 680; with a three-digit random number list, 000 and numbers above 680 would also be ignored.

Mark scheme
  1. 1 mark

    B1 for the same number may be generated more than once, and a member cannot be in the sample twice, so repeated numbers are ignored and he must keep generating numbers until he has 40 different numbers

    oe. Accept 'some numbers could come up twice, and repeats must be ignored'. Do not accept 'some numbers may be out of range' (the function only gives whole numbers from 1 to 680), 'some members may not want to take part' or 'to make it more random'. Ignore any non-contradictory or irrelevant statements.
Question 2

2 marks

A researcher wants a quota sample of 250 adults living in a town, with each age group in proportion to the adults in the town.
She uses figures from a survey of the town carried out 12 years ago. That survey found that 18% of the adults were aged 65 and over.

Work out her quota for adults aged 65 and over.
Give one problem with using the figures from this survey to set her quotas.

Model answer

\(18\% \text{ of } 250 = 0.18 \times 250 = 45\) adults aged 65 and over.
In 12 years the population of the town may have changed (for example, more people may now be aged 65 and over), so quotas based on the old figures may not match the proportions of adults in the town now.

Explanation

Quotas are worked out as percentages of the sample size, using the population proportions. A quota sample is only as good as the figures used to set the quotas: if they are out of date, the sample will have the wrong mix of groups. 'Out of date' on its own does not explain why that matters.

Mark scheme
  1. 1 mark

    B1 for 45

    From \(0.18 \times 250 = 45\).

  2. 1 mark

    B1 for the age make-up of the town may have changed in 12 years (eg the population may be older now, or people may have moved in or out, for example to new housing), so quotas based on these figures may not be in proportion to the adults in the town now

    oe. Must say that the proportions (or the population) may have changed. 'The figures are out of date' or 'old data' with no reference to a change in the population B0. 'It is secondary data' alone B0.

Question 3

3 marks

An athletics club has 2735 members on a numbered list. The secretary wants a systematic sample of about 50 members.
She uses an interval of 55. She chooses a starting number at random from 1 to 55, then takes every 55th member after that, to the end of the list.

Work out how many members are in her sample if her starting number is 23, and how many if her starting number is 47.
Explain why the number of members in her sample depends on her starting number.

Model answer

Starting number 23: the members chosen are 23, 78, 133, ..., and \(23 + 49 \times 55 = 2718\). The next would be 2773, which is beyond 2735. So there are 1 + 49 = 50 members.
Starting number 47: \(47 + 48 \times 55 = 2687\), and the next would be 2742, which is beyond 2735. So there are 1 + 48 = 49 members.
2735 is not a multiple of 55, because \(2735 \div 55 = 49.7...\). The 50th member would be the starting number \(+ 49 \times 55\), which is the starting number \(+ 2695\), and this is on the list only when the starting number is 40 or less. So starting numbers 1 to 40 give 50 members, and 41 to 55 give only 49.

Explanation

When the population size is not an exact multiple of the interval, the sample size depends on the random start: a late start leaves no room at the end of the list for the last member. Count the members as 1 for the start plus the number of whole intervals that fit before the end of the list. Each member still has the same chance, \(\dfrac{1}{55}\), of being chosen; it is only the sample size that varies.

Mark scheme
  1. 1 mark

    B1 for 50 members when the starting number is 23

    eg \(23 + 49 \times 55 = 2718\) and the next number, 2773, is beyond 2735; or \((2735 - 23) \div 55 = 49.3...\), so 49 more members after member 23. Correct answer with no working scores B1.

  2. 1 mark

    B1 for 49 members when the starting number is 47

    eg \(47 + 48 \times 55 = 2687\) and the next number, 2742, is beyond 2735; or \((2735 - 47) \div 55 = 48.8...\), so 48 more members after member 47. Correct answer with no working scores B1. 50 for both starting numbers scores B1B0.

  3. 1 mark

    B1 for 2735 is not a multiple of 55 (\(2735 \div 55 = 49.7...\)), so after 49 intervals there is room on the list for a 50th member only when the starting number is small enough (starting numbers 1 to 40 give 50 members, and 41 to 55 give 49)

    oe. Accept 'the list does not split exactly into blocks of 55, so with a late start the list ends before the 50th member'. Must refer to the size of the list not being a multiple of the interval, or to the end of the list. The values 40 and 41 need not be seen. 'Because the start is random' alone B0.

Question 4

5 marks

A researcher uses a quota sample of 200 adults in a city to find out their views about a new tram line.
She set her quotas using two facts about the adults in the city: 60% have a car and 30% are aged 65 and over. So her quotas were 120 adults with a car and 80 adults without a car, and also 60 adults aged 65 and over and 140 adults aged under 65.

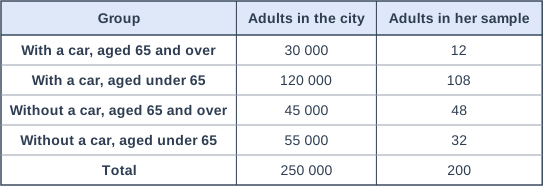
The table shows the number of adults in the city in each group, and the number in each group in her sample.

Show that her sample meets all four quotas.
Work out the number of adults aged 65 and over with a car that a sample of 200 in proportion to the adults in the city would contain.
Explain why her sample is not representative, and suggest how the quotas should have been set.

Table with columns "Group", "Adults in the city", "Adults in her sample". Group: With a car, aged 65 and over; Adults in the city: 30 000; Adults in her sample: 12 | Group: With a car, aged under 65; Adults in the city: 120 000; Adults in her sample: 108 | Group: Without a car, aged 65 and over; Adults in the city: 45 000; Adults in her sample: 48 | Group: Without a car, aged under 65; Adults in the city: 55 000; Adults in her sample: 32 | Group: Total; Adults in the city: 250 000; Adults in her sample: 200.

Model answer

With a car: \(12 + 108 = 120\); without a car: \(48 + 32 = 80\); aged 65 and over: \(12 + 48 = 60\); aged under 65: \(108 + 32 = 140\). All four quotas are met.
Adults aged 65 and over with a car, in proportion: \(\dfrac{30000}{250000} \times 200 = 24\)
Her sample has only 12 adults aged 65 and over with a car instead of 24, and 48 adults aged 65 and over without a car instead of \(\dfrac{45000}{250000} \times 200 = 36\). Setting quotas for having a car and for age separately does not control how the two are combined, so older car owners are under-represented and older people without a car are over-represented. Their views about a tram line may well be different.
She should set a quota for each of the four groups: with a car aged 65 and over 24, with a car aged under 65 96, without a car aged 65 and over 36 and without a car aged under 65 44.

Explanation

Quotas on each variable separately only fix the totals for each variable, not the numbers in the combined groups, so the interviewer can meet every quota with the wrong mix. Proportional quotas for each combination of the variables (like the cells of a two-way table) avoid this. Work out each combined quota as group size divided by the population, times the sample size.

Mark scheme
  1. 1 mark

    B1 for showing that all four quotas are met: with a car \(12 + 108 = 120\), without a car \(48 + 32 = 80\), aged 65 and over \(12 + 48 = 60\), aged under 65 \(108 + 32 = 140\)

    All four totals must be seen.

  2. 1 mark

    M1 for \(\dfrac{30000}{250000} \times 200\) oe

    oe, eg \(0.12 \times 200\). The total 250 000 may be implied.

  3. 1 mark

    A1 for 24

    Correct answer with no working scores M1A1.

  4. 1 mark

    B1ft for her sample has only 12 adults aged 65 and over with a car, half of the 24 in proportion (and 48 adults aged 65 and over without a car, more than the 36 in proportion), so these groups are under- and over-represented even though each separate quota is met; views about a tram line are likely to depend on both age and having a car

    oe. ft their answer for the adults aged 65 and over with a car. Must compare the sample with the proportional number for at least one combined group (the other proportional numbers are 96 with a car aged under 65, 36 without a car aged 65 and over, and 44 without a car aged under 65). 'The sample is biased' with no figures or reason B0.

  5. 1 mark

    B1 for setting a quota for each combination of car and age group (with a car aged 65 and over, with a car aged under 65, without a car aged 65 and over, without a car aged under 65), each in proportion to the city, eg 24, 96, 36 and 44

    oe. The numbers are not needed for this mark, but any numbers given must be correct. 'Use a stratified sample' alone B0. 'Use a bigger sample' B0.

Ready to try the rest? Every answer you write is marked against the mark scheme, so you can see exactly where the marks are.

Study Helper Hints first, answers after you try

Stuck on this one? Ask for a hint and I’ll point you in the right direction, without giving the answer away. Once you’ve checked your answer, I’ll show you how the marks are awarded.