Level:
Correct: 0
Incorrect: 0
Marks: 0/0
Exam Practice
Course:
Topics:
AQA GCSE Maths (Foundation calculator) Smart practice A mixed round aimed at your weak spots
Unit 1
Number
Unit 2
Algebra
Unit 3
Ratio, proportion and rates of change
Unit 4
Geometry and measures
Unit 5
Probability
Unit 6
Statistics
Avg
score:
–
Topics
done:
0/86

Scatter graphs and correlation

Practise 28 exam-style questions on Scatter graphs and correlation for AQA GCSE Maths (Foundation calculator). Write your answer as you would in the exam and get it marked in seconds against the mark scheme, point by point, with the Study Helper on hand if you get stuck.

  • 28 questions
  • 1–5 marks each
  • Instant marking
  • No sign-up needed
20 questions, marked as you go

Sample questions with model answers

Here are 4 of the questions in this topic, each with a model answer, an explanation of why it earns the marks and the mark scheme an examiner would use.

Question 1

1 mark

The scatter graph shows the time some students spent revising and their test marks.
A line of best fit has been drawn.

Use the line of best fit to estimate the test mark of a student who revised for 4.5 hours.
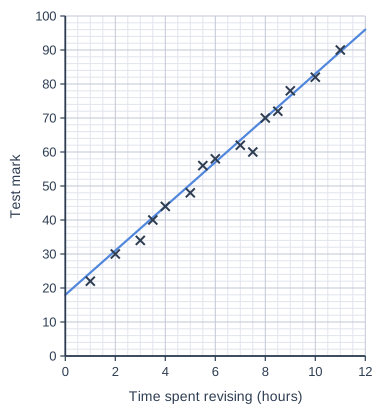
Scatter graph on a grid of small squares. The horizontal axis is "Time spent revising (hours)", from 0 to 12, numbered every 2, with 4 small squares between numbered values (each small square is 0.5). The vertical axis is "Test mark", from 0 to 100, numbered every 10, with 5 small squares between numbered values (each small square is 2). 15 points are plotted as crosses: (1, 22), (2, 30), (3, 34), (3.5, 40), (4, 44), (5, 48), (5.5, 56), (6, 58), (7, 62), (7.5, 60), (8, 70), (8.5, 72), (9, 78), (10, 82) and (11, 90). A straight line of best fit is drawn; it passes through (0, 18) and (12, 96).

Model answer

Go up from 4.5 hours to the line of best fit, then across to the vertical axis.
The estimated mark is about 47.

Explanation

To estimate from a line of best fit, go up from the value on the horizontal axis to the line, then across to the vertical axis and read the value. Use the line, not the nearest point. Estimating inside the range of the data like this is called interpolation.

Mark scheme
  1. 1 mark

    B1 for an answer in the range [45, 50]

    the line gives 47.25
Question 2

2 marks

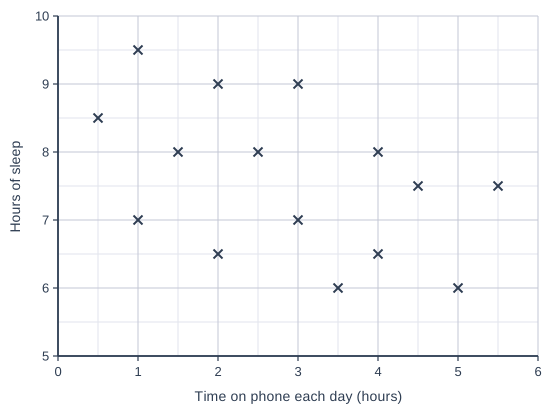
The scatter graph shows the time some students spend on their phone each day and how many hours they sleep.

Describe the type and the strength of the correlation.

Scatter graph on a grid of small squares. The horizontal axis is "Time on phone each day (hours)", from 0 to 6, numbered every 1, with 2 small squares between numbered values (each small square is 0.5). The vertical axis is "Hours of sleep", from 5 to 10, numbered every 1, with 2 small squares between numbered values (each small square is 0.5). 15 points are plotted as crosses: (0.5, 8.5), (1, 7), (1, 9.5), (1.5, 8), (2, 9), (2, 6.5), (2.5, 8), (3, 7), (3, 9), (3.5, 6), (4, 8), (4, 6.5), (4.5, 7.5), (5, 6) and (5.5, 7.5).

Model answer

There is weak negative correlation.
As the time on the phone increases, the hours of sleep tend to decrease, but the points are spread out and not close to a straight line.

Explanation

The general trend goes down from left to right, so the correlation is negative. The points are widely scattered around the trend rather than close to a line, so the correlation is weak. Strong correlation has points lying close to a straight line.

Mark scheme
  1. 1 mark

    B1 for negative

  2. 1 mark

    B1 for weak

    do not accept strong

Question 3

2 marks

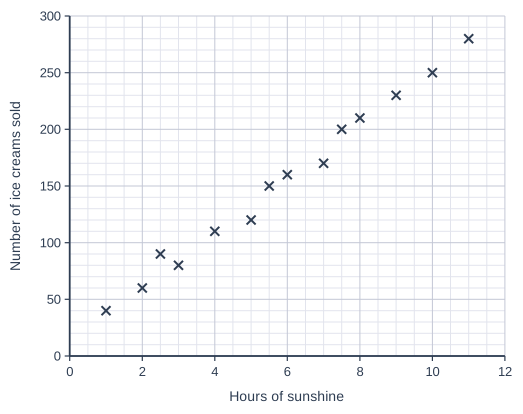
A shop records the number of hours of sunshine and the number of ice creams it sells on 14 days.
The scatter graph shows the results.

On one day the shop sold 100 ice creams.

Estimate the number of hours of sunshine on that day.

Scatter graph on a grid of small squares. The horizontal axis is "Hours of sunshine", from 0 to 12, numbered every 2, with 4 small squares between numbered values (each small square is 0.5). The vertical axis is "Number of ice creams sold", from 0 to 300, numbered every 50, with 5 small squares between numbered values (each small square is 10). 14 points are plotted as crosses: (1, 40), (2, 60), (2.5, 90), (3, 80), (4, 110), (5, 120), (5.5, 150), (6, 160), (7, 170), (7.5, 200), (8, 210), (9, 230), (10, 250) and (11, 280).

Model answer

A line of best fit goes through about (2, 63) and (10, 253).
Going across from 100 ice creams to this line and down gives about 3.6 hours of sunshine.

Explanation

Imagine a line of best fit through the middle of the points. This time start on the vertical axis at 100, go across to the line and then down to the horizontal axis. Each small square on the horizontal axis is 0.5 hours.

Mark scheme
  1. 2 marks

    B2 for an answer in the range [3.2, 4] hours

    B1 for an answer in the range [3, 4.2], or a line of best fit described and used at 100 ice creams; the least squares line gives 3.56 hours

Question 4

4 marks

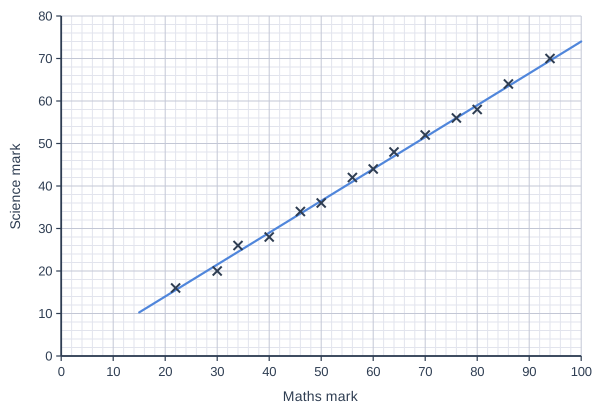
The scatter graph shows the maths and science marks of some students.
A line of best fit has been drawn.

The science test is out of 80.
To pass, a student needs at least 60% of the marks.

Three students missed the science test.
Their maths marks were 52, 74 and 83.
The teacher uses the line of best fit to estimate their science marks.

How many of the three students are estimated to pass the science test?
You must show your working.

Scatter graph on a grid of small squares. The horizontal axis is "Maths mark", from 0 to 100, numbered every 10, with 5 small squares between numbered values (each small square is 2). The vertical axis is "Science mark", from 0 to 80, numbered every 10, with 5 small squares between numbered values (each small square is 2). 14 points are plotted as crosses: (22, 16), (30, 20), (34, 26), (40, 28), (46, 34), (50, 36), (56, 42), (60, 44), (64, 48), (70, 52), (76, 56), (80, 58), (86, 64) and (94, 70). A straight line of best fit is drawn; it passes through (20, 14) and (100, 74).

Model answer

Pass mark = 60% of 80 = 48
From the line of best fit:
maths 52 → science about 38 (fail)
maths 74 → science about 54.5 (pass)
maths 83 → science about 61 (pass)
2 of the students are estimated to pass.

Explanation

First change the pass mark into a number of marks: 60% of 80 = 48. Then go up from each maths mark to the line of best fit and across to read the estimated science mark. Compare each estimate with 48.

Mark scheme
  1. 1 mark

    B1 for 60% of 80 = 48

  2. 1 mark

    M1 for reading the line at one of the maths marks

    or reading the maths mark at a science mark of 48 (about 65)

  3. 1 mark

    A1 for 52 → [36, 40], 74 → [52, 57] and 83 → [59, 64]

    the line gives 38, 54.5 and 61.25; or the maths mark at 48 in [63, 68]

  4. 1 mark

    A1 for 2 students (those with 74 and 83)

    answer only scores 0 (working required)

Ready to try the rest? Every answer you write is marked against the mark scheme, so you can see exactly where the marks are.

Study Helper Hints first, answers after you try

Stuck on this one? Ask for a hint and I’ll point you in the right direction, without giving the answer away. Once you’ve checked your answer, I’ll show you how the marks are awarded.