Practise 28 exam-style questions on Gradient as a rate of change for AQA GCSE Maths (Foundation calculator). Write your answer as you would in the exam and get it marked in seconds against the mark scheme, point by point, with the Study Helper on hand if you get stuck.
28 questions
1–5 marks each
Instant marking
No sign-up needed
20 questions, marked as you go
Sample questions with model answers
Here are 4 of the questions in this topic, each with a model answer, an explanation of why it earns the marks and the mark scheme an examiner would use.
Question 1
1 mark
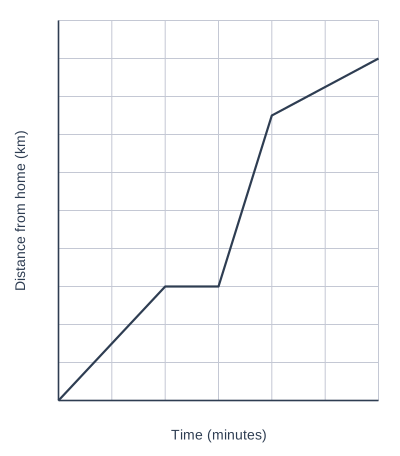
The graph shows Ali's bike ride from his home.
Between which two times was Ali cycling fastest?
Model answer
The steepest part of the graph is between 45 minutes and 60 minutes. Ali cycled 9 km in 15 minutes then, which is the fastest part.
Explanation
On a distance-time graph the gradient is the speed, so the steepest section is the fastest. Between 45 and 60 minutes Ali cycled 9 km in 15 minutes (36 km/h), much faster than the other sections. The flat section, from 30 to 45 minutes, is where he stopped.
Mark scheme
1 mark
B1 for between 45 minutes and 60 minutes
accept 45 to 60 minutes; accept a description of the steepest section
Question 2
2 marks
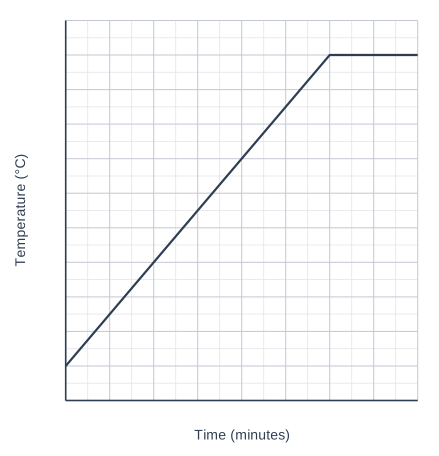
The graph shows the temperature inside an oven after it is switched on.
Work out the rate at which the temperature increases during the first 12 minutes. Give the units of your answer.
Model answer
In 12 minutes the temperature rises from 20 °C to 200 °C. Increase = 200 − 20 = 180 °C Rate = 180 ÷ 12 = 15 °C per minute
Explanation
The rate of increase is the gradient: the change in temperature divided by the change in time. The oven starts at 20 °C, not 0 °C, so the increase is 180 °C. The units are degrees per minute because you divide degrees by minutes.
Mark scheme
1 mark
M1 for (200 − 20) ÷ 12
or a correct gradient from two other points on the sloping line
1 mark
A1 for 15 °C per minute
units required; accept 15 degrees per minute or 15 °C/min; 16.6... (from 200 ÷ 12) scores 0
Question 3
3 marks
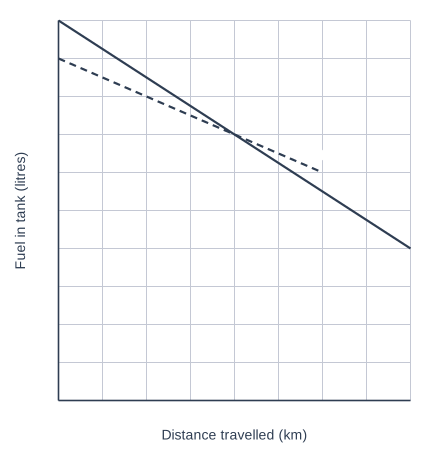
The graph shows the amount of fuel in the tanks of two cars, A and B, as they travel.
Which car uses fuel at the greater rate? You must show your working.
Model answer
Car A uses 50 − 20 = 30 litres in 400 km: 30 ÷ 400 = 0.075 litres per km. Car B uses 45 − 30 = 15 litres in 300 km: 15 ÷ 300 = 0.05 litres per km. 0.075 is more than 0.05, so Car A uses fuel at the greater rate.
Explanation
The rate at which fuel is used is the gradient of each line (litres used ÷ km travelled). The lines go over different distances, so you must work out the rate for each car rather than just compare the fuel used. Car A's line is steeper, and its rate is 0.075 litres per km compared with 0.05.
Mark scheme
1 mark
M1 for a correct rate for one car, e.g. Car A: (50 − 20) ÷ 400 (= 0.075 litres per km) or Car B: (45 − 30) ÷ 300 (= 0.05 litres per km)
or litres per 100 km (7.5 and 5), or km per litre (13.3... and 20), or fuel used by each car in the same distance, e.g. in 300 km Car A uses 22.5 litres and Car B uses 15 litres
1 mark
M1 for correct rates for both cars
rates must be in the same form
1 mark
A1 for Car A, with correct rates for both cars
answer only scores 0
Question 4
4 marks
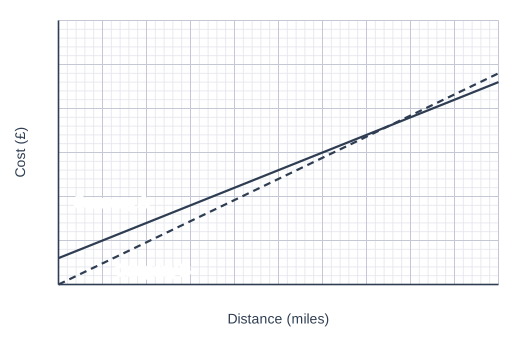
The graph shows the cost of a taxi journey with two taxi companies.
Jo is going to make a 15-mile journey. Which company will be cheaper for her journey? You must show your working.
Model answer
Company A: starts at £3 and goes up £20 in 10 miles, so £2 per mile. 15 miles: 3 + 2 × 15 = £33 Company B: £24 for 10 miles, so £2.40 per mile. 15 miles: 2.40 × 15 = £36 Company A is cheaper for a 15-mile journey.
Explanation
The graph only goes to 10 miles, so use the gradients (cost per mile). Company A has a fixed charge of £3 plus £2 per mile; Company B has no fixed charge but costs £2.40 per mile. Company B is cheaper for short journeys, but its steeper line means Company A becomes cheaper for longer ones.
Mark scheme
1 mark
M1 for a correct cost per mile for one company: £2 for Company A or £2.40 for Company B
e.g. (23 − 3) ÷ 10 or 24 ÷ 10
1 mark
M1 for the cost of 15 miles with one company: 3 + 2 × 15 (= 33) or 2.4 × 15 (= 36)
ft their cost per mile; or 23 + 5 × 2 or 24 + 5 × 2.4
1 mark
M1 for the cost of 15 miles with both companies
ft their costs per mile
1 mark
A1 for Company A, with £33 and £36
answer only scores 0
Ready to try the rest? Every answer you write is marked against the mark scheme, so you can see exactly where the marks are.
Ctrl + Enter to check
Study HelperHints first, answers after you try
Stuck on this one? Ask for a hint and I’ll point you in the right direction, without giving the answer away. Once you’ve checked your answer, I’ll show you how the marks are awarded.