Level:
Correct: 0
Incorrect: 0
Marks: 0/0
Exam Practice
Course:
Topics:
AQA GCSE Maths (Foundation calculator) Smart practice A mixed round aimed at your weak spots
Unit 1
Number
Unit 2
Algebra
Unit 3
Ratio, proportion and rates of change
Unit 4
Geometry and measures
Unit 5
Probability
Unit 6
Statistics
Avg
score:
–
Topics
done:
0/86

Real-life and non-standard graphs

Practise 28 exam-style questions on Real-life and non-standard graphs for AQA GCSE Maths (Foundation calculator). Write your answer as you would in the exam and get it marked in seconds against the mark scheme, point by point, with the Study Helper on hand if you get stuck.

  • 28 questions
  • 1–5 marks each
  • Instant marking
  • No sign-up needed
20 questions, marked as you go

Sample questions with model answers

Here are 4 of the questions in this topic, each with a model answer, an explanation of why it earns the marks and the mark scheme an examiner would use.

Question 1

1 mark

The graph shows the battery charge of Nina's phone.

Use the graph to find the battery charge after 4 hours.
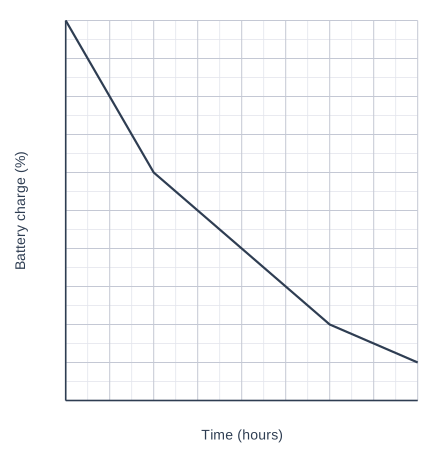
A graph of Battery charge (%) (vertical axis, 0 to 100, marked every 10) against Time (hours) (horizontal axis, 0 to 8, marked every 1), on a grid with 2 small squares to each large square. The graph is made of straight-line sections; its values can be read from the grid.

Model answer

Up from 4 hours to the line, then across: 40%

Explanation

Find 4 hours on the time axis, go up to the graph and across to the battery charge axis. Each small square up is 5%. The graph is steeper at the start, which shows the phone was being used more in the first 2 hours.

Mark scheme
  1. 1 mark

    B1 for 40%

    accept any value in [39, 41]
Question 2

2 marks

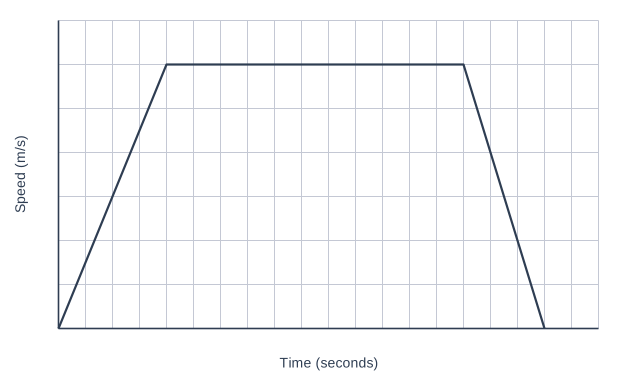
The speed-time graph shows the first 40 seconds of a car journey.

Describe the motion of the car between 8 seconds and 30 seconds.

A graph of Speed (m/s) (vertical axis, 0 to 14, marked every 2) against Time (seconds) (horizontal axis, 0 to 40, marked every 2), on a grid. The graph is made of straight-line sections joining (0, 0), (8, 12), (30, 12) and (36, 0).

Model answer

The line is horizontal, so the speed does not change.
The car travels at a constant speed of 12 m/s.

Explanation

On a speed-time graph a horizontal line means the speed is staying the same, so the car is moving at a constant speed - not stopped. Do not confuse it with a distance-time graph, where a horizontal line means not moving.

Mark scheme
  1. 1 mark

    B1 for constant speed

    accept steady speed, not accelerating; do not accept 'not moving' or 'stopped'

  2. 1 mark

    B1 for 12 m/s

Question 3

3 marks

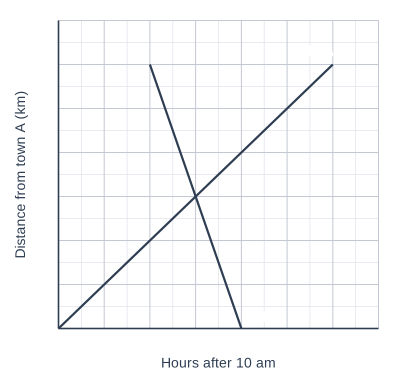
Anna walks from town A to town B.
Ben cycles from town B to town A along the same road.
The graph shows their journeys.

Use the graph to write down
the time when Anna and Ben pass each other
how far from town A they are when they pass each other
who finishes their journey first.

A graph of Distance from town A (km) (vertical axis, 0 to 14, marked every 2) against Hours after 10 am (horizontal axis, 0 to 3.5, marked every 0.5), on a grid with 2 small squares to each large square. The graph labelled "Anna" is a straight line joining (0, 0) and (3, 12). Graph Ben is a straight line joining (1, 12) and (2, 0). The graph labelled "Anna" and graph Ben cross at one point, which can be read from the grid.

Model answer

The lines cross at (1.5, 6).
They pass each other 1.5 hours after 10 am, at 11:30 am.
They are 6 km from town A.
Ben reaches town A at 2 hours (12 noon) and Anna reaches town B at 3 hours (1 pm), so Ben finishes first.

Explanation

When two people are at the same distance from town A at the same time, they are in the same place, so they pass where the lines cross. Remember the time axis is hours after 10 am, so 1.5 hours means 11:30 am. Each journey finishes where its line ends.

Mark scheme
  1. 1 mark

    B1 for 11:30 am

    accept 1.5 hours after 10 am, or 1 hour 30 minutes after 10 am

  2. 1 mark

    B1 for 6 km

  3. 1 mark

    B1 for Ben

    Ben arrives at town A at 12 noon; Anna arrives at town B at 1 pm

Question 4

4 marks

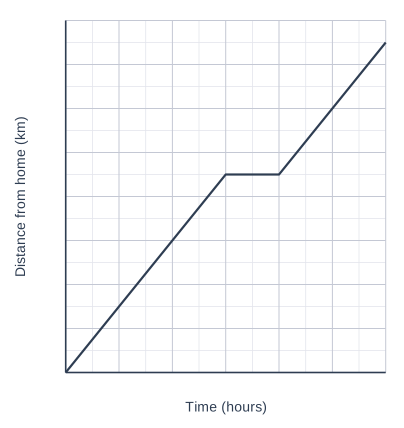
The graph shows Raj's car journey from home.
Raj stopped once during the journey.

Raj says,
"I drove at 60 km/h for both parts of the journey, so my average speed for the whole journey was 60 km/h."

Is Raj correct?
You must show your working.

A graph of Distance from home (km) (vertical axis, 0 to 160, marked every 20) against Time (hours) (horizontal axis, 0 to 3, marked every 0.5), on a grid with 2 small squares to each large square. The graph is made of straight-line sections joining (0, 0), (1.5, 90), (2, 90) and (3, 150).

Model answer

First part: 90 km in 1.5 hours = 60 km/h. Second part: 60 km in 1 hour = 60 km/h.
Total distance = 150 km
Total time = 3 hours (including the 0.5 hour stop)
Average speed = 150 ÷ 3 = 50 km/h
Raj is not correct. His average speed for the whole journey was 50 km/h.

Explanation

Average speed for a whole journey = total distance ÷ total time, and the total time includes any stops. Raj did drive at 60 km/h while moving, but the half-hour stop adds time without adding distance, so his average speed is lower.

Mark scheme
  1. 1 mark

    M1 for total distance 150 km

  2. 1 mark

    M1 for total time 3 hours (including the stop)

  3. 1 mark

    M1dep for 150 ÷ 3

    ft their total distance ÷ their total time

  4. 1 mark

    A1 for No, with an average speed of 50 km/h

    answer only scores 0

Ready to try the rest? Every answer you write is marked against the mark scheme, so you can see exactly where the marks are.

Study Helper Hints first, answers after you try

Stuck on this one? Ask for a hint and I’ll point you in the right direction, without giving the answer away. Once you’ve checked your answer, I’ll show you how the marks are awarded.