Level:
Correct: 0
Incorrect: 0
Marks: 0/0
Exam Practice
Course:
Topics:
AQA GCSE Maths (Foundation calculator) Smart practice A mixed round aimed at your weak spots
Unit 1
Number
Unit 2
Algebra
Unit 3
Ratio, proportion and rates of change
Unit 4
Geometry and measures
Unit 5
Probability
Unit 6
Statistics
Avg
score:
–
Topics
done:
0/86

Gradients and intercepts

Practise 28 exam-style questions on Gradients and intercepts for AQA GCSE Maths (Foundation calculator). Write your answer as you would in the exam and get it marked in seconds against the mark scheme, point by point, with the Study Helper on hand if you get stuck.

  • 28 questions
  • 1–5 marks each
  • Instant marking
  • No sign-up needed
20 questions, marked as you go

Sample questions with model answers

Here are 4 of the questions in this topic, each with a model answer, an explanation of why it earns the marks and the mark scheme an examiner would use.

Question 1

1 mark

Write down the gradient of the line \(y = 7\)

Model answer

\(y = 7\) is a horizontal line (\(y = 0x + 7\)).
Gradient = 0

Explanation

The line \(y = 7\) is horizontal: y stays at 7 whatever x is, so the line does not go up or down at all. Its gradient is 0. You can think of it as \(y = 0x + 7\). The 7 is the y-intercept.

Mark scheme
  1. 1 mark

    B1 for 0

    do not accept 7

Question 2

2 marks

Work out the gradient of the straight line that passes through the points (−1.5, 4) and (2.5, −6).

Model answer

Change in y = −6 − 4 = −10
Change in x = 2.5 − (−1.5) = 4
Gradient = −10 ÷ 4 = −2.5

Explanation

Divide the change in y by the change in x, keeping the points in the same order. Here y goes down by 10 while x goes up by 4, so the gradient is negative: −2.5. Decimal coordinates work in exactly the same way as whole numbers.

Mark scheme
  1. 1 mark

    M1 for \(\dfrac{-6 - 4}{2.5 - (-1.5)}\)

    oe, e.g. \(\dfrac{-10}{4}\) or \(\dfrac{4 - (-6)}{-1.5 - 2.5}\)

  2. 1 mark

    A1 for −2.5

    oe, e.g. \(-\frac{5}{2}\); correct answer with no working scores full marks; 2.5 scores M1 A0 only if a correct method is seen

Question 3

3 marks

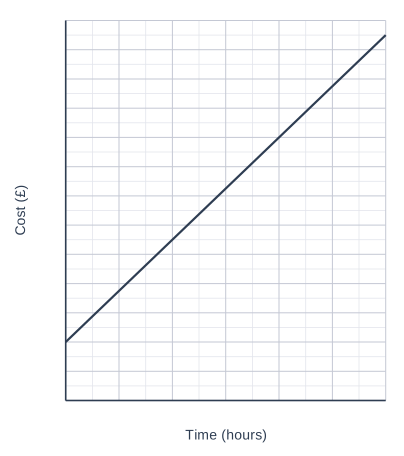
A plumber charges a fixed amount for each job plus an amount for each hour she works.
The graph shows how much she charges for jobs of up to 6 hours.

Work out the gradient of the line.
What does the gradient represent?

A graph of Cost (£) (vertical axis, 0 to 260, marked every 20) against Time (hours) (horizontal axis, 0 to 6, marked every 1), on a grid with 2 small squares to each large square. The graph is a straight line; its values can be read from the grid.

Model answer

The line passes through (0, 40) and (4, 180).
Gradient = \(\dfrac{180 - 40}{4 - 0} = \dfrac{140}{4} = 35\)
The gradient is the cost per hour: she charges £35 for each hour she works.

Explanation

The gradient of a real-life graph is a rate: the units are the vertical units per horizontal unit, here pounds per hour. Each extra hour adds £35 to the cost. Use points where the line crosses grid lines exactly so your readings are accurate.

Mark scheme
  1. 1 mark

    M1 for change in cost ÷ change in time using two points on the line, e.g. \(\dfrac{180 - 40}{4}\) or \(\dfrac{250 - 40}{6}\)

  2. 1 mark

    A1 for 35

    35 with no working scores M1 A1

  3. 1 mark

    B1 for the cost per hour (£35 for each hour she works)

    accept 'how much she charges for each hour'; do not accept 'the total cost'

Question 4

4 marks

Two companies hire out vans.

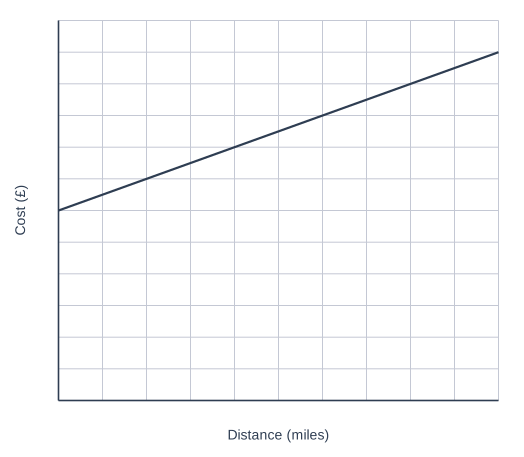
The graph shows the cost of hiring a van from Company A for one day, for distances up to 100 miles.

The cost, £C, of hiring a van from Company B for one day to drive m miles is

\(C = 0.4m + 12\)

Amy wants to hire a van for one day to drive 150 miles.
Which company is cheaper for her?
You must show your working.

A graph of Cost (£) (vertical axis, 0 to 60, marked every 5) against Distance (miles) (horizontal axis, 0 to 100, marked every 10), on a grid. The graph is a straight line; its values can be read from the grid.

Model answer

Company A: the line passes through (0, 30) and (100, 55).
Gradient = (55 − 30) ÷ 100 = 0.25, so it costs £0.25 per mile plus £30.
Cost for 150 miles = 30 + 150 × 0.25 = 30 + 37.50 = £67.50
Company B: C = 0.4 × 150 + 12 = 60 + 12 = £72
Company A is cheaper (£67.50 compared with £72).

Explanation

The graph only goes up to 100 miles, so use its intercept (the fixed charge, £30) and gradient (the cost per mile, £0.25) to work out the cost for 150 miles. Substitute m = 150 into Company B's formula. Always compare both costs and say which company is cheaper.

Mark scheme
  1. 1 mark

    M1 for Company A's gradient \(\dfrac{55 - 30}{100}\) (= 0.25) or 25p per mile

    or extending the pattern: 50 miles adds £12.50

  2. 1 mark

    M1 for 30 + 150 × their 0.25 (= 67.50)

    or 55 + 50 × their 0.25

  3. 1 mark

    M1 for 0.4 × 150 + 12 (= 72)

  4. 1 mark

    A1 for Company A, with £67.50 and £72

    answer only scores 0

Ready to try the rest? Every answer you write is marked against the mark scheme, so you can see exactly where the marks are.

Study Helper Hints first, answers after you try

Stuck on this one? Ask for a hint and I’ll point you in the right direction, without giving the answer away. Once you’ve checked your answer, I’ll show you how the marks are awarded.