Practise 36 exam-style questions on Charts, tables and diagrams for AQA GCSE Maths (Foundation calculator). Write your answer as you would in the exam and get it marked in seconds against the mark scheme, point by point, with the Study Helper on hand if you get stuck.
36 questions
1–5 marks each
Instant marking
No sign-up needed
20 questions, marked as you go
Sample questions with model answers
Here are 4 of the questions in this topic, each with a model answer, an explanation of why it earns the marks and the mark scheme an examiner would use.
Question 1
1 mark
Here are four sets of data.
A the favourite colours of 30 students B the number of pets owned by each of 30 students C the heights of 30 students D the temperature at noon each day for a month
Which set of data is best shown on a vertical line chart?
Choose your answer.
A
B
C
D
Model answer
A vertical line chart is used for ungrouped discrete numerical data. The number of pets (0, 1, 2, 3, ...) is discrete and numerical. The answer is B.
Explanation
Vertical line charts show discrete numerical data - whole-number values such as 0, 1, 2 or 3 pets - with a line for each value. Favourite colours are categories (use a bar chart or pie chart), heights are continuous, and temperatures taken each day are a time series (use a line graph).
Mark scheme
1 mark
B1 for B
accept the number of pets
Question 2
2 marks
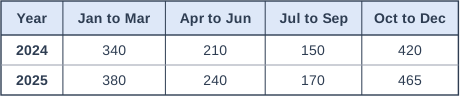
The table shows the number of umbrellas a shop sold in each quarter of 2024 and 2025.
Describe two patterns in the sales of umbrellas.
Model answer
In both years the sales are highest in October to December and lowest in July to September, so more umbrellas are sold in autumn and winter. The sales for each quarter in 2025 are higher than the sales for the same quarter in 2024, so sales are increasing.
Explanation
Time series data often has two patterns: a pattern that repeats at the same time each year (a seasonal pattern) and a general direction over time (a trend). Compare the quarters within each year, then compare the same quarter in different years. Always describe the pattern in the context of the question.
Mark scheme
1 mark
B1 for a seasonal pattern, e.g. sales are highest in October to December and lowest in July to September each year
accept sales are higher in autumn and winter than in summer oe
1 mark
B1 for a trend over time, e.g. sales in every quarter of 2025 are higher than in the same quarter of 2024
accept sales went up from 2024 to 2025 oe
Question 3
3 marks
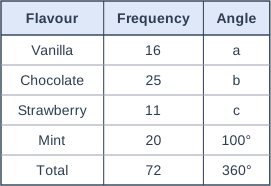
The table shows the favourite ice cream flavours of 72 people. It also shows some of the angles for a pie chart of the results.
Work out the values of a, b and c.
Model answer
Each person: 360° ÷ 72 = 5° a = 16 × 5 = 80 b = 25 × 5 = 125 c = 11 × 5 = 55 Check: 80 + 125 + 55 + 100 = 360
Explanation
All 72 people share the 360° of the pie chart, so each person is worth 360 ÷ 72 = 5°. Multiply each frequency by 5 to get its angle. You can check your answers because the angles must add up to 360°.
Mark scheme
1 mark
M1 for 360 ÷ 72 (= 5) or \(\frac{16}{72} \times 360\) oe for one angle
1 mark
A1 for two of a = 80, b = 125, c = 55
1 mark
A1 for a = 80, b = 125 and c = 55
correct answers with no working score full marks
Question 4
4 marks
There are 80 students in a year group. 45 of the students are girls. 18 of the boys walk to school. Altogether, 30 of the students walk to school.
What percentage of the students who do not walk to school are girls?
Model answer
Girls who walk: 30 − 18 = 12 Girls who do not walk: 45 − 12 = 33 Students who do not walk: 80 − 30 = 50 \(\frac{33}{50} \times 100 = 66\) 66% of the students who do not walk are girls.
Explanation
A two-way table (boys and girls against walk and do not walk) helps to organise the information. Fill in what you know and use the totals to find the missing numbers. Be careful: the question asks for a percentage of the students who do not walk (50), not of all 80 students.
Mark scheme
1 mark
M1 for 30 − 18 (= 12) girls walk
a correct two-way table with at least two correct values implies this mark
1 mark
M1 for 45 − their 12 (= 33) girls do not walk
1 mark
M1 for 80 − 30 (= 50) students do not walk and \(\frac{\text{their } 33}{50} \times 100\)
1 mark
A1 for 66%
correct answer with no working scores full marks
Ready to try the rest? Every answer you write is marked against the mark scheme, so you can see exactly where the marks are.
Ctrl + Enter to check
Study HelperHints first, answers after you try
Stuck on this one? Ask for a hint and I’ll point you in the right direction, without giving the answer away. Once you’ve checked your answer, I’ll show you how the marks are awarded.