
Level:
Correct: 0
Incorrect: 0
Marks: 0/0
Exam Practice
Course:
Topics:
AQA GCSE Maths (Foundation calculator) Smart practice A mixed round aimed at your weak spots
Unit 1
Number
Unit 2
Algebra
Unit 3
Ratio, proportion and rates of change
Unit 4
Geometry and measures
Unit 5
Probability
Unit 6
Statistics
Avg
score:
–
Topics
done:
0/86

Sample size and theoretical probability

Practise 18 exam-style questions on Sample size and theoretical probability for AQA GCSE Maths (Foundation calculator). Write your answer as you would in the exam and get it marked in seconds against the mark scheme, point by point, with the Study Helper on hand if you get stuck.

  • 18 questions
  • 1–5 marks each
  • Instant marking
  • No sign-up needed
18 questions, marked as you go

Sample questions with model answers

Here are 4 of the questions in this topic, each with a model answer, an explanation of why it earns the marks and the mark scheme an examiner would use.

Question 1

1 mark

Four students each spin the same spinner.
The table shows the number of times each student spins the spinner and the number of times it lands on red.

Whose results are likely to give the best estimate of the probability that the spinner lands on red?
Give a reason for your answer.
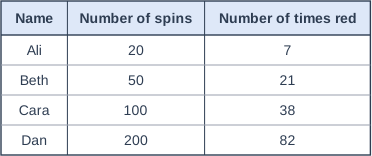
Table with columns "Name", "Number of spins", "Number of times red". Name: Ali; Number of spins: 20; Number of times red: 7 | Name: Beth; Number of spins: 50; Number of times red: 21 | Name: Cara; Number of spins: 100; Number of times red: 38 | Name: Dan; Number of spins: 200; Number of times red: 82.

Model answer

Dan, because he spun the spinner the most times (200 spins).

Explanation

Relative frequency gives a better estimate of a probability when there are more trials. Dan did 200 spins, more than anyone else, so his estimate is the most reliable. Having the most reds is not the reason - it is the number of spins that matters.

Mark scheme
  1. 1 mark

    B1 for Dan with a correct reason, e.g. he spun the spinner the most times

    accept 'he has the largest number of trials' or 'biggest sample' oe; do not accept Dan with no reason or with an incorrect reason such as 'he got the most reds'
Question 2

2 marks

Mia throws a coin 100 times.
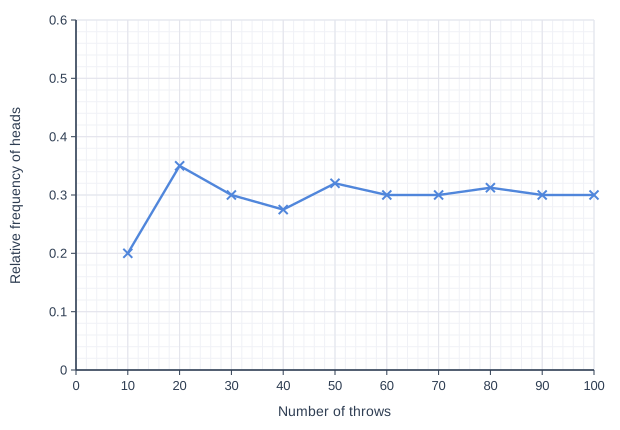
The graph shows the relative frequency of heads after every 10 throws.

Mia says,
"The coin is fair."

Is Mia correct?
Give a reason for your answer.

Line graph of relative frequency of heads (y-axis, 0 to 0.6) against number of throws (x-axis, 0 to 100). The line joins the points (10, 0.2), (20, 0.35), (30, 0.3), (40, 0.275), (50, 0.32), (60, 0.3), (70, 0.3), (80, 0.3125), (90, 0.3), (100, 0.3).

Model answer

No. The relative frequency of heads settles at about 0.3 (30 heads in 100 throws). For a fair coin it should get close to 0.5, so the coin is probably biased.

Explanation

For a fair coin the relative frequency of heads should get close to 0.5 as the number of throws increases. Here it settles at about 0.3 and stays there, even after 100 throws. That is a long way from 0.5, so the coin is probably biased towards tails.

Mark scheme
  1. 1 mark

    B1 for the relative frequency settles at about 0.3

    accept any value in [0.28, 0.32], or 30 heads in 100 throws

  2. 1 mark

    B1 for No (probably not), as the relative frequency is a long way from 0.5 after 100 throws

    must refer to 0.5 (or \(\frac{1}{2}\), or 50 heads) for a fair coin; do not accept 'No' with no reason

Question 3

3 marks

Amir rolls an ordinary six-sided dice 50 times.
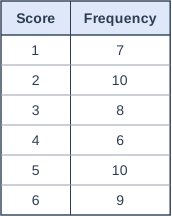
The table shows his results.

Work out the difference between the relative frequency of a 6 and the theoretical probability of a 6 for a fair dice.
Give your answer to 3 decimal places.

Table with columns "Score", "Frequency". Score: 1; Frequency: 7 | Score: 2; Frequency: 10 | Score: 3; Frequency: 8 | Score: 4; Frequency: 6 | Score: 5; Frequency: 10 | Score: 6; Frequency: 9.

Model answer

Relative frequency of a 6 = \(\frac{9}{50} = 0.18\)
Theoretical probability of a 6 = \(\frac{1}{6} = 0.16666...\)
Difference = 0.18 − 0.16666... = 0.01333...
= 0.013 (3 d.p.)

Explanation

The relative frequency is the number of times the 6 came up divided by the total number of rolls: 9 ÷ 50. For a fair dice each score has theoretical probability \(\frac{1}{6}\). Keep the full calculator value of \(\frac{1}{6}\) when you subtract, and round only at the end.

Mark scheme
  1. 1 mark

    B1 for theoretical probability \(\frac{1}{6}\) or 0.166... or 0.167

    accept 0.17 or better

  2. 1 mark

    M1 for \(9 \div 50\) or 0.18

  3. 1 mark

    A1 for 0.013

    accept any value in [0.013, 0.0134] (0.01333...); accept \(\frac{1}{75}\); correct answer with no working scores full marks

Question 4

3 marks

Noah rolls a dice 100 times.
The relative frequency of a 5 is 0.2

He rolls the same dice another 200 times.
For all 300 rolls, the relative frequency of a 5 is 0.18

How many times did Noah get a 5 in the second 200 rolls?

Model answer

Number of 5s in the first 100 rolls = 0.2 × 100 = 20
Number of 5s in all 300 rolls = 0.18 × 300 = 54
Number of 5s in the second 200 rolls = 54 − 20 = 34

Explanation

Relative frequency × number of trials gives the number of times the outcome happened. The 300 rolls include the first 100, so subtract to find the 5s in the second 200 rolls. A common mistake is to use 0.18 × 200, but 0.18 is the relative frequency for all 300 rolls.

Mark scheme
  1. 1 mark

    M1 for 0.2 × 100 (= 20) or 0.18 × 300 (= 54)

  2. 1 mark

    M1dep for their 54 − their 20

    both values must come from a relative frequency × number of rolls

  3. 1 mark

    A1 for 34

    correct answer with no working scores full marks; SC1 for 36 (from 0.18 × 200, only if no other marks are awarded)

Ready to try the rest? Every answer you write is marked against the mark scheme, so you can see exactly where the marks are.

Study Helper Hints first, answers after you try

Stuck on this one? Ask for a hint and I’ll point you in the right direction, without giving the answer away. Once you’ve checked your answer, I’ll show you how the marks are awarded.