Practise 18 exam-style questions on National and global energy resources for AQA GCSE Combined Science (Physics Paper 1). Write your answer as you would in the exam and get it marked in seconds against the mark scheme, point by point, with the Study Helper on hand if you get stuck.
18 questions
1–6 marks each
Instant marking
No sign-up needed
18 questions, marked as you go
Sample questions with model answers
Here are 4 of the questions in this topic, each with a model answer, an explanation of why it earns the marks and the mark scheme an examiner would use.
Question 1
2 marks
Bio-fuel can be made from plants such as sugar cane.
Explain why bio-fuel is a renewable energy resource.
Model answer
Bio-fuel is renewable because the plants it is made from can be grown again quickly, so the resource is replenished as fast as it is used.
Explanation
A resource is renewable if it is replaced as it is used. Crops such as sugar cane can be replanted and harvested again within a year, so bio-fuel will not run out, unlike fossil fuels, which took millions of years to form.
Mark scheme
1 mark
it can be replenished as it is used
allow it will not run out
1 mark
because new plants / crops can be grown (quickly) to replace those used
allow sugar cane can be regrown each year
Question 2
3 marks
The main uses of energy resources are transport, electricity generation and heating.
For each of these three uses, name one energy resource that is commonly used for it.
Model answer
Transport: oil, as petrol or diesel. Electricity generation: natural gas. Heating: natural gas burned in a boiler.
Explanation
Most transport uses fuels made from oil, although bio-fuels and electricity are increasingly used. Electricity is generated from many resources. Most homes in the UK are heated by burning natural gas, but electric heaters, solar water heating and geothermal heating are also used.
Mark scheme
1 mark
transport: oil (petrol / diesel) or bio-fuel
allow electricity for electric cars or trains
1 mark
electricity generation: any one of coal, natural gas, nuclear fuel, wind, hydro-electricity, solar, tides, waves, geothermal, bio-fuel
1 mark
heating: natural gas, oil, coal, wood (bio-fuel), electricity, solar or geothermal
allow solar water heating panels
Question 3
3 marks
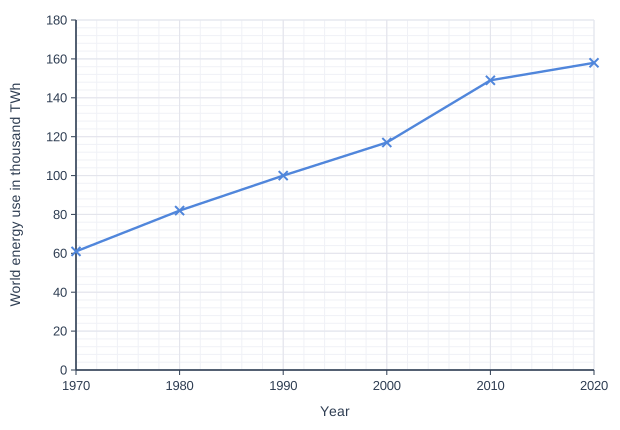
The graph shows how the total energy used each year in the world changed between 1970 and 2020.
Describe the trend shown by the graph and suggest two reasons for it.
Model answer
World energy use increased throughout the period, from about 60 thousand TWh in 1970 to about 160 thousand TWh in 2020, so it more than doubled. One reason is that the world's population has grown. Another is that many countries have become more industrialised, so more people own cars and electrical appliances.
Explanation
Describe the trend with figures from the graph before giving reasons. Energy use rises with population and with living standards, as more people use transport, heating and electrical appliances.
Mark scheme
1 mark
world energy use increased (every decade), from about 60 to about 160 thousand TWh
allow it more than doubled / increased by about 100 thousand TWh
1 mark
the world population is increasing
max 3
1 mark
more countries are becoming industrialised / developed
1 mark
more people own cars and electrical appliances / people use more energy each
allow more people have access to electricity
Question 4
4 marks
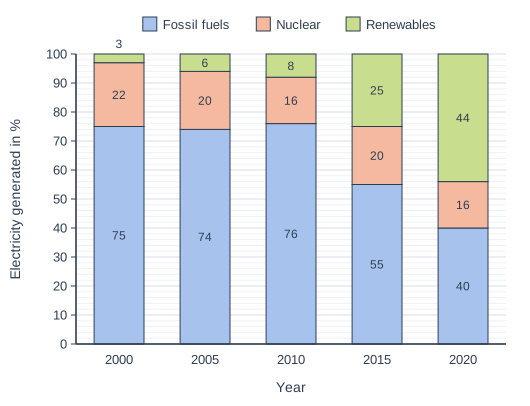
The chart shows the percentage of the electricity in one country generated from fossil fuels, nuclear fuel and renewable resources between 2000 and 2020.
Describe the trends in the use of fossil fuels and renewable resources shown in the chart, and suggest reasons for these trends.
Model answer
The percentage of electricity from fossil fuels stayed at about 75% from 2000 to 2010 and then fell sharply, to 40% in 2020. The percentage from renewable resources rose from 3% in 2000 to 44% in 2020, increasing most quickly after 2010. One reason is that the country is trying to reduce its carbon dioxide emissions to limit global warming. Another is that fossil fuels are non-renewable and will run out, while the cost of building wind turbines and solar farms has fallen.
Explanation
When describing a trend, say what happens and quote data from the chart. Reasons for the move from fossil fuels to renewables include climate change, fossil fuels running out, and the falling cost of renewable technology.
Mark scheme
1 mark
the percentage from fossil fuels stayed about the same (about 75%) from 2000 to 2010, then fell to 40% by 2020
allow fossil fuels decreased; must refer to data for this mark
1 mark
the percentage from renewables increased from 3% to 44%, increasing fastest after 2010
allow renewables increased
1 mark
reason: to reduce carbon dioxide emissions / to reduce global warming / to meet climate change targets
max 4
1 mark
reason: fossil fuels are non-renewable and will run out
1 mark
reason: renewable technology has become cheaper / governments gave subsidies for renewables
Ready to try the rest? Every answer you write is marked against the mark scheme, so you can see exactly where the marks are.
Ctrl + Enter to check
Study HelperHints first, answers after you try
Stuck on this one? Ask for a hint and I’ll point you in the right direction, without giving the answer away. Once you’ve checked your answer, I’ll show you how the marks are awarded.