Level:
Correct: 0
Incorrect: 0
Marks: 0/0
Exam Practice
Course:
Topics:
Avg
score:
–
Topics
done:
0/30

Half-lives and the random nature of radioactive decay

Practise 12 exam-style questions on Half-lives and the random nature of radioactive decay for AQA GCSE Combined Science (Physics Paper 1). Write your answer as you would in the exam and get it marked in seconds against the mark scheme, point by point, with the Study Helper on hand if you get stuck.

  • 12 questions
  • 1–6 marks each
  • Instant marking
  • No sign-up needed
12 questions, marked as you go

Sample questions with model answers

Here are 4 of the questions in this topic, each with a model answer, an explanation of why it earns the marks and the mark scheme an examiner would use.

Question 1

2 marks

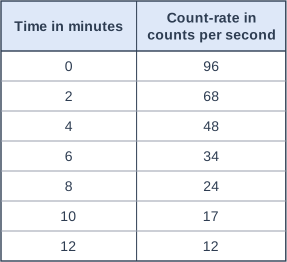
The table shows how the count-rate from a radioactive source changed over 12 minutes.

Use the data to determine the half-life of the source.

Table with columns "Time in minutes", "Count-rate in counts per second". Time in minutes: 0; Count-rate in counts per second: 96 | Time in minutes: 2; Count-rate in counts per second: 68 | Time in minutes: 4; Count-rate in counts per second: 48 | Time in minutes: 6; Count-rate in counts per second: 34 | Time in minutes: 8; Count-rate in counts per second: 24 | Time in minutes: 10; Count-rate in counts per second: 17 | Time in minutes: 12; Count-rate in counts per second: 12.

Model answer

The count-rate falls from 96 to 48 counts per second between 0 and 4 minutes, from 48 to 24 between 4 and 8 minutes, and from 24 to 12 between 8 and 12 minutes. Each halving takes 4 minutes, so the half-life is 4 minutes.

Explanation

Look for a value and its half in the table, and find the time between them. Checking more than one pair confirms the half-life is constant, as it should be.

Mark scheme
  1. 1 mark

    a correct halving read from the table, e.g. 96 to 48 counts per second takes 4 minutes

    allow 48 to 24 from 4 to 8 minutes, or 24 to 12 from 8 to 12 minutes

  2. 1 mark

    half-life = 4 minutes

Question 2

2 marks

A student finds the half-life of an isotope by measuring the count-rate from a sample with a Geiger-Muller tube, instead of measuring the activity of the sample.

Explain why the half-life she finds is the same as the time for the activity to halve.

Model answer

The Geiger-Muller tube always records the same fraction of the decays from the sample, so the count-rate is proportional to the activity. When the activity halves, the count-rate also halves, so the time for the count-rate to fall to half is the same as the half-life.

Explanation

Half-life can be defined either as the time for the number of nuclei to halve or the time for the count-rate (or activity) to fall to half. As long as the detector and source stay in the same positions, the count-rate is a fixed fraction of the activity.

Mark scheme
  1. 1 mark

    the count-rate is proportional to the activity / the detector records the same fraction of the decays all the time

    allow when the activity halves the count-rate halves

  2. 1 mark

    so the count-rate falls to half its initial level in the same time as the activity

Question 3

3 marks

Radioactive decay is random.

Explain how a radioactive isotope can have a fixed half-life even though radioactive decay is random.

Model answer

Because radioactive decay is random, it is impossible to predict which nucleus will decay next or when any particular nucleus will decay. However, a sample contains a huge number of nuclei. With so many nuclei, the same proportion of them decays in a given time, so it always takes the same time for half of the nuclei to decay. This time is the half-life.

Explanation

Randomness applies to individual nuclei; half-life describes what happens to a large number of them. Just as you cannot predict one coin toss but can predict that about half of 10 000 coins will land heads, you cannot predict one decay but can predict the half-life.

Mark scheme
  1. 1 mark

    it is impossible to predict which nucleus will decay next / when a particular nucleus will decay

  2. 1 mark

    a sample contains a very large number of nuclei

  3. 1 mark

    so the same proportion of the nuclei decays in a given time / it always takes the same time for half of them to decay

    allow the overall pattern is predictable even though individual decays are not

Question 4

4 marks

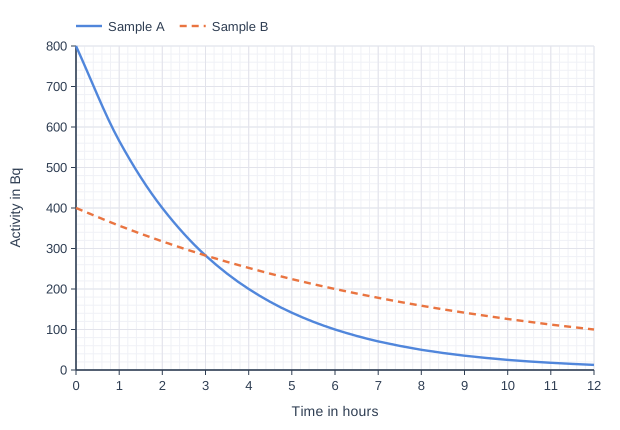
The graph shows how the activities of two radioactive samples, A and B, change with time.

Determine the half-life of each sample.
Then give the time at which the two samples have the same activity, and the value of that activity.

Line graph of Activity in Bq (y-axis, 0 to 800) against time in hours (x-axis, 0 to 12). "Sample A" is a smooth curve through (0, 800), (1, 565.7), (2, 400), (3, 282.8), (4, 200), (5, 141.4), (6, 100), (7, 70.7), (8, 50), (9, 35.4), (10, 25), (11, 17.7), (12, 12.5). "Sample B" (dashed) is a smooth curve through (0, 400), (1, 356.4), (2, 317.5), (3, 282.8), (4, 252), (5, 224.5), (6, 200), (7, 178.2), (8, 158.7), (9, 141.4), (10, 126), (11, 112.2), (12, 100).

Model answer

Sample A falls from 800 Bq to 400 Bq in 2 hours, so its half-life is 2 hours.
Sample B falls from 400 Bq to 200 Bq in 6 hours, so its half-life is 6 hours.
The two lines cross at 3 hours, when both samples have an activity of about 280 Bq.

Explanation

A sample with a short half-life starts by losing activity very quickly. Sample A starts with twice the activity of B, but because its half-life is shorter its activity drops below B's after 3 hours. Read each half-life from the time taken for that sample's activity to halve.

Mark scheme
  1. 1 mark

    half-life of A = 2 hours

    allow 1.8-2.2 hours

  2. 1 mark

    half-life of B = 6 hours

    allow 5.5-6.5 hours

  3. 1 mark

    same activity at 3 hours

    allow 2.8-3.2 hours

  4. 1 mark

    activity ≈ 280 Bq

    allow 260-300 Bq

Ready to try the rest? Every answer you write is marked against the mark scheme, so you can see exactly where the marks are.

Revision notes

Half-lives and the random nature of radioactive decay

The big idea

Radioactive decay is random: nobody can predict when one particular nucleus will decay. But a sample contains billions of nuclei, and with numbers that large the overall pattern is very predictable. The number of undecayed nuclei, and so the activity, always halves in the same time. That time is the half-life, and it lets you predict how a radioactive sample will change.

Random decay

  • You cannot predict which nucleus will decay next, or when a particular nucleus will decay.
  • Every nucleus of the isotope has the same chance of decaying in a given time, whatever the other nuclei do.
  • In a very large number of nuclei, the same proportion decays in each equal time interval. So as the number of undecayed nuclei falls, fewer decay each second and the activity falls too.

Think of tossing a million coins: you cannot say which coin will land heads, but you can be sure that very close to half of them will. Because decay is random, count-rate readings scatter a little about the true value, so you draw a smooth curve of best fit through them rather than joining the points.

What half-life means

The half-life of a radioactive isotope is:

  • the time it takes for the number of nuclei of the isotope in a sample to halve, or
  • the time it takes for the count-rate (or activity) from a sample containing the isotope to fall to half its initial level.

The half-life is the same for every sample of a particular isotope, large or small. After each half-life, what is left halves again:

\[\text{fraction remaining} = \left(\dfrac{1}{2}\right)^{n}\]

where \(n\) is the number of half-lives. This is not on the equation sheet: it just means halving \(n\) times. So after 1, 2, 3 and 4 half-lives, \(\tfrac{1}{2}\), \(\tfrac{1}{4}\), \(\tfrac{1}{8}\) and \(\tfrac{1}{16}\) of the nuclei remain. A sample never suddenly runs out after two half-lives.

Finding a half-life from a graph

Line graph of corrected count-rate in counts per minute (y-axis, 0 to 600) against time in minutes (x-axis, 0 to 40). "Decay curve" is a smooth curve through (0, 600), (4, 424.3), (8, 300), (12, 212.1), (16, 150), (20, 106.1), (24, 75), (28, 53), (32, 37.5), (36, 26.5), (40, 18.8). "600 to 300: 8 minutes" (dashed) joins the points (0, 300), (8, 300), (8, 0). "300 to 150: 8 more minutes" (dashed) joins the points (0, 150), (16, 150), (16, 0).
The count-rate halves every 8 minutes, so the half-life is 8 minutes.
  1. If the readings include background radiation, subtract the background count-rate first: background does not decay, so leaving it in makes the half-life look too long.
  2. Pick a starting value on the curve and halve it.
  3. Draw lines on the graph to read the time taken to fall to that value.
  4. Repeat from another starting value and take the mean, as a check.

Planning a hospital scan

A sample of fluorine-18 for a hospital scan has an activity of 480 MBq at 9:00 am. The half-life of fluorine-18 is 110 minutes. At what time will its activity have fallen to 60 MBq?

Halve until you reach 60 MBq: \(480 \rightarrow 240 \rightarrow 120 \rightarrow 60\), which is 3 half-lives.

Time: \(3 \times 110 = 330\) minutes, which is 5 hours 30 minutes.

The activity is 60 MBq at 2:30 pm.

Higher tier only

Net decline as a ratio. The net decline is how much the activity (or count-rate) has fallen, not how much is left. After \(n\) half-lives:

\[\text{net decline} = 1 - \left(\dfrac{1}{2}\right)^{n} \text{ of the initial value}\]

This is not on the equation sheet either: work it out from the fraction remaining.

Half-livesFraction remainingNet decline
11/21/2
21/43/4
31/87/8
41/1615/16

Worked example: iodine-123, used for thyroid scans, has a half-life of 13 hours. How long does it take for the activity to show a net decline of 7 : 8 (seven-eighths of its starting value)?

Fraction remaining: \(1 - \dfrac{7}{8} = \dfrac{1}{8} = \left(\dfrac{1}{2}\right)^{3}\), so 3 half-lives.

Time: \(3 \times 13 = 39\) hours.

Watch out: if a question asks for the net decline, do not give the fraction remaining. After 4 half-lives the net decline is 15 : 16, not 1 : 16.

Common mistakes

  • Saying the half-life is half of the time for all the nuclei to decay. It is the time for the number of nuclei (or the activity) to halve.
  • Dividing by the number of half-lives. After 3 half-lives, divide by \(2 \times 2 \times 2 = 8\), not by 3.
  • Halving a count-rate that still includes background radiation. Subtract the background first.
  • Thinking a bigger sample has a longer half-life. A bigger sample has a higher activity, but the same half-life.

Exam tip

Show the halving chain (480 → 240 → 120 → 60) or the lines you drew on the graph: if your final answer is wrong, the working still earns marks. When a question says "explain the concept of half-life", link it to randomness: each nucleus has the same chance of decaying, and large numbers make the pattern predictable.

Study Helper Hints first, answers after you try

Stuck on this one? Ask for a hint and I’ll point you in the right direction, without giving the answer away. Once you’ve checked your answer, I’ll show you how the marks are awarded.