
Level:
Correct: 0
Incorrect: 0
Marks: 0/0
Exam Practice
Course:
Topics:
AQA A-Level Biology (Paper 1) Smart practice A mixed round aimed at your weak spots
Unit 1
Biological molecules
Unit 2
Cells
Unit 3
Organisms exchange substances with their environment
Unit 4
Genetic information, variation and relationships between organisms
DNA, genes and chromosomes
0%
Genetic diversity can arise as a result of mutation or during meiosis
Gene mutations and chromosome non-disjunction
0%
Meiosis and genetic variation
0%
Genetic diversity and adaptation
0%
Species and taxonomy
0%
Biodiversity within a community
0%
Investigating diversity
0%
Avg
score:
–
Topics
done:
0/35

Xylem and the cohesion-tension theory

Practise 18 exam-style questions on Xylem and the cohesion-tension theory for AQA A-Level Biology (Paper 1). Write your answer as you would in the exam and get it marked in seconds against the mark scheme, point by point, with the Study Helper on hand if you get stuck.

  • 18 questions
  • 1–8 marks each
  • Instant marking
  • No sign-up needed
18 questions, marked as you go

Sample questions with model answers

Here are 4 of the questions in this topic, each with a model answer, an explanation of why it earns the marks and the mark scheme an examiner would use.

Question 1

2 marks

The diagram shows part of a xylem vessel from the stem of a plant.

Name substance X and explain how it helps the xylem vessel to transport water when the plant is transpiring rapidly.
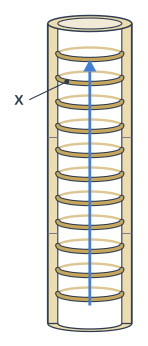
Diagram: a long vertical tube with thick walls, drawn as if you can see into it: it is open at the top (its end shows as a ring) and at the bottom, it is empty inside with no cross walls, and darker hoops thicken its wall all the way round at regular intervals. A blue arrow inside the tube points upwards. Label X points to one of the darker hoops that thicken the wall all the way round the tube.

Model answer

X is lignin. It strengthens the walls of the vessel, so the vessel does not collapse inwards when the water inside it is under tension during rapid transpiration.

Explanation

When a plant transpires rapidly, the water in the xylem is pulled up under tension (negative pressure), which pulls inwards on the walls. Rings or spirals of lignin strengthen the walls so the vessel stays open. Lignin also makes the walls waterproof, but that does not explain how the vessel copes with tension.

Mark scheme
  1. 1 mark

    Lignin

    Accept phonetic spellings such as 'lignen'. Reject 'cellulose', 'suberin' or 'chitin'.

  2. 1 mark

    Strengthens the wall so the vessel does not collapse (inwards) under tension / negative pressure

    Accept 'keeps the vessel open when water is pulled up under tension'. Ignore 'waterproofs the vessel' and 'supports the plant' unless linked to resisting tension.
Question 2

3 marks

A student set up a potometer to measure the rate of water uptake by a leafy shoot. Give three precautions she should take when setting up the potometer, and explain why each is necessary.

Model answer

1. Cut the shoot under water, so that air does not enter the xylem and break the column of water.
2. Seal all the joints with petroleum jelly, so the apparatus is airtight and the movement of the bubble shows only the water taken up by the shoot.
3. Gently dry the leaves before starting, because water on the leaf surface would change the rate of evaporation.

Explanation

Most potometer precautions are about air and water: air in the xylem breaks the continuous water column, and leaks make the bubble movement unreliable. Each mark needs both the precaution and why it matters. 'Make it a fair test' is not a reason.

Mark scheme
  1. 1 mark

    Cut the shoot under water, so air does not enter the xylem / the water column is not broken

    Max 3. Each point needs the precaution AND its reason. List rule: if more than three precautions are given, each wrong extra answer cancels one correct answer.

  2. 1 mark

    Fit the shoot into the potometer under water / fill the potometer so there are no air bubbles (except the one used for measuring), so the water column is continuous / readings are accurate

  3. 1 mark

    Make the joints airtight / seal with petroleum jelly, so no air enters and no water leaks out / so bubble movement shows only water uptake by the shoot

    Accept 'waterproof the joints'.

  4. 1 mark

    Dry the leaves (gently), so water on their surface does not affect the rate of evaporation / does not block the stomata

  5. 1 mark

    Leave the shoot to acclimatise / for a few minutes before taking readings, so the rate becomes steady / stomata adjust to the conditions

  6. 1 mark

    Cut the stem at a slant, so there is a larger surface area for water uptake / the cut end is not blocked

Question 3

4 marks

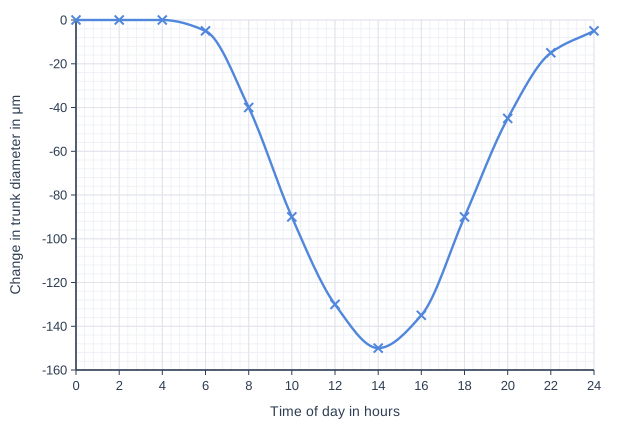
Scientists used a sensor to record changes in the diameter of the trunk of a tree during one sunny day. The graph shows the changes, relative to the diameter of the trunk at midnight (0 hours). At midnight, the diameter of the trunk was 0.42 m.

Use the graph to calculate the maximum percentage decrease in the diameter of the trunk during the day. Give your answer in standard form.

Explain the decrease in the diameter of the trunk between 6 and 14 hours.

Line graph of change in trunk diameter in μm (y-axis, -160 to 0) against time of day in hours (x-axis, 0 to 24). The line is a smooth curve through (0, 0), (2, 0), (4, 0), (6, -5), (8, -40), (10, -90), (12, -130), (14, -150), (16, -135), (18, -90), (20, -45), (22, -15), (24, -5).

Model answer

Maximum decrease = 150 μm = 0.000 15 m
Percentage decrease = 0.000 15 ÷ 0.42 × 100 = 0.0357% = 3.6 × 10⁻² %

After 6 hours, light intensity and temperature increase, so the stomata open and the rate of transpiration increases. This increases the tension in the water in the xylem. Because water adheres to the xylem walls, the tension pulls the walls inwards, so the trunk becomes narrower, reaching its minimum diameter at about 14 hours when transpiration is fastest.

Explanation

Convert both lengths to the same unit before dividing: 150 μm is 1.5 × 10⁻⁴ m. The daily shrinking of tree trunks is evidence for the cohesion-tension theory: the water in the xylem is under tension, which pulls the walls inwards most strongly when transpiration is fastest. If water were pushed up under pressure, the trunk would swell instead.

Mark scheme
  1. 1 mark

    Correct method: 150 μm (0.000 15 m) ÷ 0.42 m × 100; or a correct final answer of 3.6 × 10⁻² % with no working

    Max 4. A correct answer of 3.6 × 10⁻² (accept 3.57 × 10⁻² or 3.571 × 10⁻²) with no working scores 2 marks (points 1 and 2). Accept for 1 mark: 3.6 × 10⁻⁴ (not multiplied by 100) OR 0.036 (correct value not in standard form) OR evidence of 1.5 × 10⁻⁴ m (the decrease converted to metres).

  2. 1 mark

    3.6 × 10⁻² (%) (accept 3.57 × 10⁻² or 3.571 × 10⁻²)

    Accept any clear typed form of standard form, e.g. 3.6E-2.

  3. 1 mark

    (More light / higher temperature, so) stomata open / more transpiration / more evaporation from the leaves

    Points 3 to 5: max 2.

  4. 1 mark

    (So) more tension / negative pressure in the xylem

    Accept 'water is pulled up the xylem faster'.

  5. 1 mark

    Adhesion of water to the xylem walls (and cohesion) pulls the walls inwards, so the xylem vessels / trunk become narrower

    Accept 'the tension pulls the xylem walls in'.

Question 4

5 marks

Leaves usually have more stomata on their lower surface than on their upper surface. Petroleum jelly is a waterproof grease.

Describe how a student could use a potometer and petroleum jelly to investigate whether a leafy shoot loses more water from the upper or the lower surfaces of its leaves.

Model answer

Cut a leafy shoot under water and fit it to the potometer under water, sealing the joints with petroleum jelly so they are airtight. Leave it for a few minutes until the rate is steady, then measure the distance the bubble moves in 5 minutes with no petroleum jelly on the leaves. Use the reservoir to return the bubble to the start. Then cover the upper surface of every leaf with petroleum jelly and measure the rate again. Do the same with a similar shoot that has the lower surfaces covered. Keep the light intensity, temperature, humidity and air movement the same throughout, repeat each treatment three times and calculate the mean. The treatment that causes the bigger decrease in rate shows the surface that loses more water.

Explanation

Petroleum jelly blocks the stomata on the surface it covers, so comparing the rate of uptake before and after covering each surface shows how much water was lost through that surface. A good method includes a control, the setting-up precautions, control variables and repeats. Remember that a shoot cannot be 'uncovered' once greased, so use similar shoots or a sequence that allows subtraction.

Mark scheme
  1. 1 mark

    Cut the shoot under water and fit it to the potometer under water / make the joints airtight

    Max 5.

  2. 1 mark

    Measure the distance moved by the bubble in a set time / calculate the rate of water uptake with no petroleum jelly on the leaves (as a control)

  3. 1 mark

    Cover the upper surfaces of all the leaves with petroleum jelly and measure the rate again

  4. 1 mark

    Cover the lower surfaces (of the leaves of a similar shoot, or both surfaces) and measure the rate again

    Accept 'calculate the loss from the lower surface by subtraction'.

  5. 1 mark

    Keep light intensity, temperature, humidity and air movement constant

    Accept any two of these.

  6. 1 mark

    Allow time for the rate to become steady / the shoot to acclimatise before taking readings

  7. 1 mark

    Use the reservoir (tap) to return the bubble to the start between readings

  8. 1 mark

    Repeat each treatment (with different shoots) and calculate a mean

  9. 1 mark

    Use shoots with the same / similar leaf area / calculate the rate per unit leaf area

    Accept 'shoots of the same species and size'.

  10. 1 mark

    Compare the decreases in rate: the treatment with the bigger decrease (lower surfaces covered) shows the surface that loses more water

Ready to try the rest? Every answer you write is marked against the mark scheme, so you can see exactly where the marks are.

Study Helper Hints first, answers after you try

Stuck on this one? Ask for a hint and I’ll point you in the right direction, without giving the answer away. Once you’ve checked your answer, I’ll show you how the marks are awarded.