Level:
Correct: 0
Incorrect: 0
Marks: 0/0
Exam Practice
Course:
Topics:
AQA A-Level Biology (Paper 1) Smart practice A mixed round aimed at your weak spots
Unit 1
Biological molecules
Unit 2
Cells
Unit 3
Organisms exchange substances with their environment
Unit 4
Genetic information, variation and relationships between organisms
DNA, genes and chromosomes
0%
Genetic diversity can arise as a result of mutation or during meiosis
Gene mutations and chromosome non-disjunction
0%
Meiosis and genetic variation
0%
Genetic diversity and adaptation
0%
Species and taxonomy
0%
Biodiversity within a community
0%
Investigating diversity
0%
Avg
score:
–
Topics
done:
0/35

All cells arise from other cells

Practise 21 exam-style questions on All cells arise from other cells for AQA A-Level Biology (Paper 1). Write your answer as you would in the exam and get it marked in seconds against the mark scheme, point by point, with the Study Helper on hand if you get stuck.

  • 21 questions
  • 1–8 marks each
  • Instant marking
  • No sign-up needed
20 questions, marked as you go

Sample questions with model answers

Here are 4 of the questions in this topic, each with a model answer, an explanation of why it earns the marks and the mark scheme an examiner would use.

Question 1

2 marks

Chromosomes cannot be seen with an optical microscope in a stained cell at interphase, but they can be seen at prophase.

Explain why.

Model answer

During interphase the DNA is uncoiled and spread through the nucleus as long, thin threads, which are too thin to be seen as separate chromosomes. In prophase the chromosomes condense (supercoil), becoming much shorter and thicker, so they can be seen with an optical microscope.

Explanation

The chromosomes are present all through the cell cycle; what changes is how tightly the DNA is coiled. Uncoiled DNA in interphase can be replicated and transcribed, but it is too thin to resolve as separate threads. Condensing the chromosomes in prophase makes them visible and also stops the long molecules tangling when they are separated. A common error is to say chromosomes 'form' or 'appear from nowhere' in prophase.

Mark scheme
  1. 1 mark

    In prophase, chromosomes / DNA condense / supercoil / coil up, so they become shorter and thicker

    Accept 'DNA wound more tightly (around histones)'. Accept chromatin for DNA.

  2. 1 mark

    In interphase, the DNA is uncoiled / spread out as long, thin threads (that are too thin to see as separate structures)

    Accept 'chromatin is dispersed through the nucleus'. Ignore references to the nuclear envelope. Reject 'chromosomes are not present in interphase'.
Question 2

3 marks

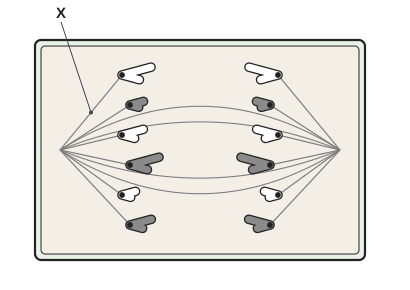
The figure shows a plant cell during mitosis.

Name the structure labelled X.

The chromatids in this cell appear V-shaped. Explain why.

A rectangular plant cell with a cell wall. Fine fibres run from a point at the left end and a point at the right end of the cell. Six V-shaped strands are in the left half of the cell and six in the right half; each V has a dot at its point, the points face the nearer end of the cell, and each dot is joined to a fibre from that end. Some fibres run all the way from one end to the other. Label X points to a fibre joining the left end to the top V-shaped strand on the left.

Model answer

X is a spindle fibre.

Each chromatid is attached to a spindle fibre at its centromere. As the spindle fibres shorten, the centromere is pulled towards the pole first, and the two arms of the chromatid trail behind it, so each chromatid looks like a V with its point facing the pole.

Explanation

The cell is in anaphase: the centromeres have divided and the sister chromatids are being pulled to opposite poles. The spindle fibre pulls only at the centromere, so the arms of the chromatid are dragged behind and the chromatid bends into a V. Plant cells have no centrioles, but they still form a spindle. Saying only that 'the chromatids are pulled apart' does not explain the shape.

Mark scheme
  1. 1 mark

    (X =) spindle fibre

    Accept spindle / microtubule. Reject centromere, centriole, chromatid, cell plate or cytoskeleton on its own.

  2. 1 mark

    Spindle fibres are attached to (each chromatid at) the centromere

    Accept 'the centromere is the part joined to the spindle'. Accept chromosome for chromatid.

  3. 1 mark

    (The fibres shorten and) the centromere is pulled first / leads (towards the pole), so the arms of the chromatid trail behind

    Accept 'arms are dragged behind the centromere'. Insufficient: 'chromatids are pulled to the poles' with no idea of the centromere leading and the arms trailing.

Question 3

3 marks

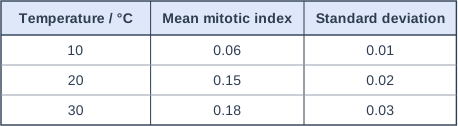
Scientists grew pea seedlings at 10 °C, 20 °C and 30 °C. They calculated the mitotic index in the root tip of each of 12 seedlings at each temperature. The table shows their results.

The scientists concluded that the mitotic index of pea root tips increases as the temperature increases from 10 °C to 30 °C.

Evaluate this conclusion. Mean ± 2 standard deviations includes over 95% of the data.

Table with columns "Temperature / °C", "Mean mitotic index", "Standard deviation". Temperature / °C: 10; Mean mitotic index: 0.06; Standard deviation: 0.01 | Temperature / °C: 20; Mean mitotic index: 0.15; Standard deviation: 0.02 | Temperature / °C: 30; Mean mitotic index: 0.18; Standard deviation: 0.03.

Model answer

Mean ± 2 SD: 10 °C = 0.04 to 0.08; 20 °C = 0.11 to 0.19; 30 °C = 0.12 to 0.24.
The ranges for 10 °C and 20 °C do not overlap, so the increase between these temperatures is probably not due to chance, which supports the conclusion. However, the ranges for 20 °C and 30 °C overlap, so the difference between these means may be due to chance, and the data do not show a real increase between 20 °C and 30 °C. Also, only three temperatures were tested, so the pattern between them is not known.

Explanation

To compare means with their standard deviations, work out mean ± 2 SD for each. Where two ranges do not overlap, the difference between the means is probably real (not due to chance); where they overlap, it may be due to chance. Here the evidence supports an increase from 10 °C to 20 °C but not from 20 °C to 30 °C, so the conclusion is only partly supported. Always say it is the difference that may be due to chance, not 'the results'.

Mark scheme
  1. 1 mark

    Correct ranges of mean ± 2 SD for at least two temperatures: 0.04 to 0.08 at 10 °C, 0.11 to 0.19 at 20 °C, 0.12 to 0.24 at 30 °C

    Max 3. Accept the ranges described in words with the values.

  2. 1 mark

    The ranges at 10 °C and 20 °C do not overlap, so this increase / difference is (probably) not due to chance / is significant

    Reject 'the results are not due to chance' or 'the results are significant' (it is the difference that may or may not be due to chance).

  3. 1 mark

    The ranges at 20 °C and 30 °C overlap, so this difference may be due to chance / is not significant, so the conclusion is not supported between 20 °C and 30 °C

    Reject 'the results are due to chance'.

  4. 1 mark

    Only three temperatures were tested / no data between the temperatures tested

    Accept 'the trend between the temperatures is not known'. Ignore 'only 12 seedlings' unless linked to reliability of the means. Ignore 'only one type of plant' (the conclusion is only about pea).

  5. 1 mark

    Other variables that affect cell division (e.g. light intensity, water supply, age of the seedlings, time of day the root tips were taken) are not stated as controlled

    Accept any one named variable that could affect the mitotic index. Ignore 'other variables' with none named.

Question 4

5 marks

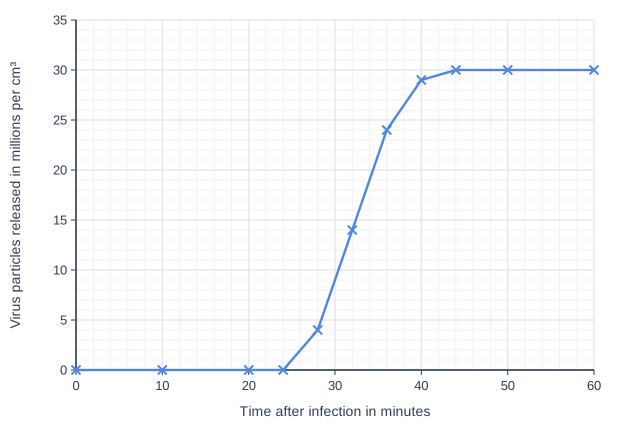
Scientists investigated how a virus that infects bacteria replicates. They mixed a culture of bacteria with the virus so that each bacterium was infected by one virus particle. They then removed all the virus particles that had not infected a bacterium. The culture contained 2.5 × 10⁵ infected bacteria per cm³.

At intervals, the scientists measured the number of virus particles released into the medium. The graph shows their results.

Explain why no virus particles were released in the first 24 minutes.

Calculate the mean number of virus particles released by each infected bacterium.

Line graph of virus particles released in millions per cm³ (y-axis, 0 to 35) against time after infection in minutes (x-axis, 0 to 60). The line joins the points (0, 0), (10, 0), (20, 0), (24, 0), (28, 4), (32, 14), (36, 24), (40, 29), (44, 30), (50, 30), (60, 30).

Model answer

In the first 24 minutes, the viral nucleic acid has been injected into each bacterium. The bacterium then replicates the viral nucleic acid and uses its ribosomes to make viral proteins for new capsids. New virus particles are assembled inside the cell, and they are only released when the bacterium bursts, so no particles are released until this has happened.

Number released at the end = 30 million per cm³ = 3.0 × 10⁷ per cm³
Mean per bacterium = 3.0 × 10⁷ ÷ 2.5 × 10⁵ = 120

Explanation

Viruses are not cells and do not divide; the infected host cell makes new virus particles from the injected nucleic acid. Replication of the nucleic acid, production of proteins and assembly all happen inside the cell, which is why there is a delay before particles are released when the cell bursts. The calculation uses the final plateau, when all the infected bacteria have burst: 30 million particles from 250 000 cells is 120 each. Read the axis unit carefully (millions per cm³).

Mark scheme
  1. 1 mark

    Calculation: correct method, e.g. (30 × 10⁶) ÷ (2.5 × 10⁵); or a correct final answer of 120 with no working

    Max 5. Points 1 and 2 are for the calculation: a correct answer of 120 with no working scores 2 marks. Accept for 1 mark: evidence of 3.0 × 10⁷ / 30 000 000 (plateau correctly read and converted) OR 1.2 × 10ⁿ with an incorrect power of 10 (e.g. 0.00012 or 1.2). Points 3 to 7 are for the explanation: max 3.

  2. 1 mark

    120

  3. 1 mark

    The viral nucleic acid is injected into / enters the bacterium

    Accept DNA/RNA/genetic material for nucleic acid. Reject 'the virus divides' or 'the virus undergoes binary fission or mitosis' (viruses do not divide).

  4. 1 mark

    The host cell / bacterium replicates the viral nucleic acid

    Accept 'copies of the viral DNA/RNA are made by the bacterium's enzymes'.

  5. 1 mark

    The host cell makes viral proteins / capsids (using its ribosomes, enzymes and ATP)

  6. 1 mark

    New virus particles are assembled inside the bacterium

  7. 1 mark

    Virus particles are only released when the bacterium bursts / lyses (which takes time)

    Accept 'released only after assembly is complete'.

Ready to try the rest? Every answer you write is marked against the mark scheme, so you can see exactly where the marks are.

Study Helper Hints first, answers after you try

Stuck on this one? Ask for a hint and I’ll point you in the right direction, without giving the answer away. Once you’ve checked your answer, I’ll show you how the marks are awarded.