Level:
Correct: 0
Incorrect: 0
Marks: 0/0
Exam Practice
Course:
Topics:
AQA A-Level Biology (Paper 1) Smart practice A mixed round aimed at your weak spots
Unit 1
Biological molecules
Unit 2
Cells
Unit 3
Organisms exchange substances with their environment
Unit 4
Genetic information, variation and relationships between organisms
DNA, genes and chromosomes
0%
Genetic diversity can arise as a result of mutation or during meiosis
Gene mutations and chromosome non-disjunction
0%
Meiosis and genetic variation
0%
Genetic diversity and adaptation
0%
Species and taxonomy
0%
Biodiversity within a community
0%
Investigating diversity
0%
Avg
score:
–
Topics
done:
0/35

Investigating diversity

Practise 17 exam-style questions on Investigating diversity for AQA A-Level Biology (Paper 1). Write your answer as you would in the exam and get it marked in seconds against the mark scheme, point by point, with the Study Helper on hand if you get stuck.

  • 17 questions
  • 1–8 marks each
  • Instant marking
  • No sign-up needed
17 questions, marked as you go

Sample questions with model answers

Here are 4 of the questions in this topic, each with a model answer, an explanation of why it earns the marks and the mark scheme an examiner would use.

Question 1

2 marks

A student investigated variation in the number of seeds in the pods of broad bean plants growing in a large field. She collected 10 pods from the plants nearest to the gate of the field.

Suggest why her sample might not be representative of the plants in the field. Explain why collecting a larger sample would improve her investigation.

Model answer

The plants near the gate may be different from the rest of the field, for example because people walking through the gate trample them and compact the soil, so the sample is biased; it was not random. A larger sample would reduce the effect of any unusual pods on the mean, so the mean would be more representative of the whole field.

Explanation

A sample is only useful if it represents the population. Sampling from one convenient place introduces bias, which random sampling avoids. Larger samples reduce the effect of chance and anomalous values, so the mean and standard deviation are closer to those of the whole population.

Mark scheme
  1. 1 mark

    Plants near the gate may be different, e.g. trampled / growing in compacted soil / getting more light, so the sample is biased OR the sample is not random / not every plant had an equal chance of being chosen

    Accept either idea for this mark.

  2. 1 mark

    A larger sample reduces the effect of anomalous / extreme values on the mean OR gives a mean closer to the true mean of the population / that is more representative (of the field)

    Ignore 'more accurate' or 'more reliable' unless explained. Ignore 'fairer'.
Question 2

3 marks

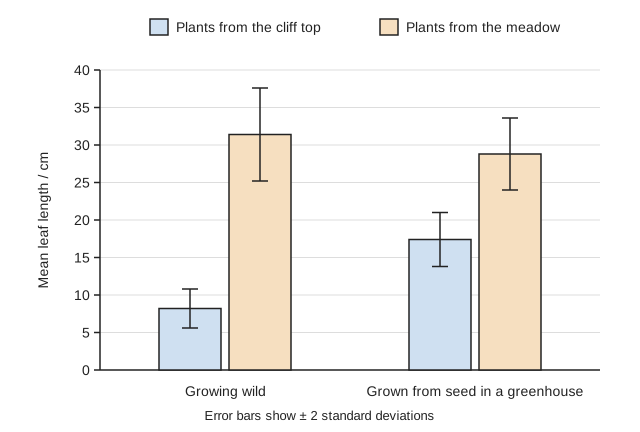
Ribwort plantain plants growing on an exposed cliff top have much shorter leaves than plants growing in a sheltered meadow nearby. Scientists measured the leaf length of 30 wild plants in each place. They also collected seeds from both places and grew 30 plants from each in a greenhouse, where all the plants had the same conditions. The graph shows their results.

The error bars represent ± 2 standard deviations from the mean, which includes over 95% of the data.

What can you conclude from these results about the causes of the difference in leaf length between the cliff-top plants and the meadow plants? Explain your answer.

A bar chart of mean leaf length in cm (y-axis, 0 to 40) with error bars. Two groups of bars: Growing wild, and Grown from seed in a greenhouse. In each group one bar is for plants from the cliff top and one for plants from the meadow. Growing wild: cliff top 8.2 cm (error bar from 5.6 to 10.8), meadow 31.4 cm (25.2 to 37.6). Grown in a greenhouse: cliff top 17.4 cm (13.8 to 21.0), meadow 28.8 cm (24.0 to 33.6). The error bars show plus or minus 2 standard deviations.

Model answer

The difference is partly genetic: when both groups were grown in the same greenhouse conditions, the cliff-top plants still had shorter leaves (about 17 cm compared with about 29 cm), and the error bars do not overlap, so this difference is probably not due to chance. The difference is also partly caused by the environment: the cliff-top plants grew much longer leaves in the greenhouse than in the wild (about 17 cm compared with about 8 cm), so the difference between the groups was smaller in the greenhouse (about 11 cm) than in the wild (about 23 cm).

Explanation

Growing plants from different places in identical conditions separates genetic from environmental causes: any difference that remains must be genetic. This shows why observable characteristics are an unreliable guide to genetic differences - the environment can exaggerate or hide them - and why direct comparison of DNA has replaced them. Use the error bars correctly: it is the difference between the means that may or may not be due to chance, not the results.

Mark scheme
  1. 1 mark

    In the greenhouse / the same conditions, the cliff-top plants still had shorter leaves (about 17 cm compared with about 29 cm), so (part of) the difference is genetic / due to different alleles

    Max 3. Accept readings within 1 cm of the values in the description.

  2. 1 mark

    In the greenhouse, the error bars / ± 2 SD ranges do not overlap, so the difference is (probably) not due to chance / is significant

    Reject 'the results are not due to chance' or 'the results are significant'.

  3. 1 mark

    The difference is smaller in the greenhouse (about 11 cm compared with about 23 cm in the wild) OR cliff-top plants grew longer leaves in the greenhouse (about 17 cm compared with about 8 cm), so the environment also affects leaf length

    Accept 'the cliff-top environment (e.g. wind / exposure) reduces leaf length'.

  4. 1 mark

    Leaf length is affected by both genes and the environment, so the difference in the wild cannot be used on its own to infer genetic differences

Question 3

3 marks

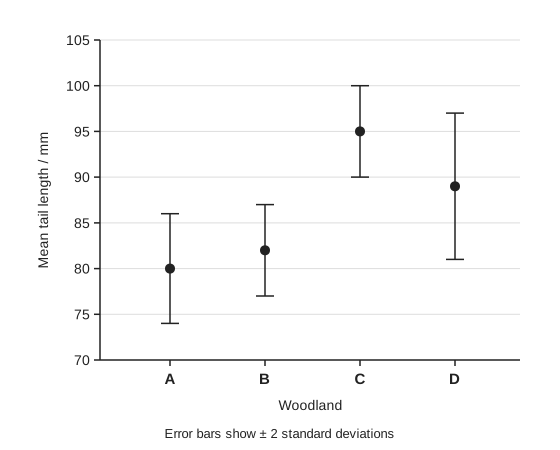
Wood mice were caught in four woodlands, A to D, and the length of each mouse's tail was measured. The graph shows the mean tail length in each woodland.

The error bars represent ± 2 standard deviations from the mean, which includes over 95% of the data.

A student concluded that the wood mice in woodland C have longer tails than the mice in each of the other woodlands, and that these differences are not due to chance. Use the graph to evaluate this conclusion.

A graph of mean tail length in mm (y-axis, 70 to 105) for wood mice in four woodlands, A, B, C and D (x-axis). Each mean is a dot with an error bar showing plus or minus 2 standard deviations. A: mean 80, error bar from 74 to 86. B: mean 82, from 77 to 87. C: mean 95, from 90 to 100. D: mean 89, from 81 to 97.

Model answer

Mice in woodland C have the longest mean tail length (95 mm). Its error bar (90 to 100 mm) does not overlap with those of A (74 to 86 mm) or B (77 to 87 mm), so these differences are probably not due to chance. However, it does overlap with the error bar of D (81 to 97 mm), so the difference between C and D may be due to chance. The conclusion is only supported for woodlands A and B, not D.

Explanation

Error bars of ± 2 standard deviations show the range that includes over 95% of the data. Non-overlapping bars suggest that the difference between two means is probably not due to chance; overlapping bars suggest it may be. Check every comparison the conclusion makes - here 'each of the other woodlands' fails for D.

Mark scheme
  1. 1 mark

    (Supports) mice in woodland C have the longest mean tail length (95 mm)

    Max 3.

  2. 1 mark

    The error bars for C do not overlap with those for A or B, so these differences are (probably) not due to chance / are significant

    Reject 'the results are not due to chance' or 'the results are significant'.

  3. 1 mark

    The error bars for C and D overlap, so the difference between C and D may be due to chance / is not significant (so the conclusion is not supported for woodland D)

    Reject 'the results are due to chance'.

  4. 1 mark

    A statistical test / t-test is needed to confirm whether the differences are significant OR the sample sizes are not given

Question 4

5 marks

Scientists want to compare the genetic diversity of red squirrels in two isolated populations: one on a small island and one in a large mainland forest. They plan to compare DNA base sequences.

Describe how they could collect and use DNA base sequence data to compare the genetic diversity of the two populations.

Do not include details of how DNA is extracted or sequenced in your answer.

Model answer

The scientists should trap squirrels at randomly chosen positions in each area, using random numbers, so the samples are not biased, and take a hair or tissue sample from the same large number of squirrels (for example 40) in each population. They should sequence the same sections of DNA in every squirrel, using several different genes rather than one, so that the results represent more of the genome. For each gene they should count the number of different base sequences (alleles) in each population, and compare the sequences of pairs of individuals to find the mean number of base differences. The population with more different sequences and more differences between individuals has the greater genetic diversity. A t-test on the mean number of differences would show whether the difference between the populations is significant.

Explanation

Genetic diversity is the number of different alleles in a population, so comparing DNA base sequences measures it directly. A good plan uses random, large and equal samples, the same genes in every individual, and several genes so that one unusual gene does not mislead. Small isolated populations such as island squirrels often have fewer alleles, so the scientists would expect lower diversity on the island.

Mark scheme
  1. 1 mark

    Take DNA samples (e.g. hair / tissue) from a large number of squirrels in each population

    Max 5.

  2. 1 mark

    Select the squirrels at random, e.g. trap them at randomly chosen positions / use random numbers

    Insufficient: 'choose the squirrels at random' with no method and no reason. Accept 'select them at random so that the sample is representative / not biased'.

  3. 1 mark

    Use the same number of squirrels from each population

  4. 1 mark

    Sequence the same gene(s) / the same section(s) of DNA in every squirrel

  5. 1 mark

    Sequence several / many genes or sections of DNA, not just one (so the results represent the whole genome)

  6. 1 mark

    Count the number of different base sequences / alleles of each gene in each population

  7. 1 mark

    Compare the base sequences of pairs of individuals to find the number of base differences / percentage similarity

  8. 1 mark

    The population with more different sequences / more differences between individuals / lower percentage similarity has the greater genetic diversity

  9. 1 mark

    Use a statistical test (e.g. a t-test on the mean number of differences) to find out whether the difference between the populations is significant

    Accept 'calculate a mean and standard deviation for each population'.

Ready to try the rest? Every answer you write is marked against the mark scheme, so you can see exactly where the marks are.

Study Helper Hints first, answers after you try

Stuck on this one? Ask for a hint and I’ll point you in the right direction, without giving the answer away. Once you’ve checked your answer, I’ll show you how the marks are awarded.