
Level:
Correct: 0
Incorrect: 0
Marks: 0/0
Exam Practice
Course:
Topics:
AQA A-Level Biology (Paper 1) Smart practice A mixed round aimed at your weak spots
Unit 1
Biological molecules
Unit 2
Cells
Unit 3
Organisms exchange substances with their environment
Unit 4
Genetic information, variation and relationships between organisms
DNA, genes and chromosomes
0%
Genetic diversity can arise as a result of mutation or during meiosis
Gene mutations and chromosome non-disjunction
0%
Meiosis and genetic variation
0%
Genetic diversity and adaptation
0%
Species and taxonomy
0%
Biodiversity within a community
0%
Investigating diversity
0%
Avg
score:
–
Topics
done:
0/35

Methods of studying cells

Practise 18 exam-style questions on Methods of studying cells for AQA A-Level Biology (Paper 1). Write your answer as you would in the exam and get it marked in seconds against the mark scheme, point by point, with the Study Helper on hand if you get stuck.

  • 18 questions
  • 1–8 marks each
  • Instant marking
  • No sign-up needed
18 questions, marked as you go

Sample questions with model answers

Here are 4 of the questions in this topic, each with a model answer, an explanation of why it earns the marks and the mark scheme an examiner would use.

Question 1

2 marks

In an electron micrograph, a ribosome with an actual diameter of 25 nm appears 3.0 mm in diameter.

Calculate the magnification of the micrograph. Give your answer in standard form.

Model answer

Image size = 3.0 mm = 3.0 × 10⁶ nm
Magnification = image size ÷ actual size = 3.0 × 10⁶ ÷ 25 = 120 000 = 1.2 × 10⁵

Explanation

Both sizes must be in the same unit: 1 mm = 1000 μm = 1 000 000 nm, so 3.0 mm = 3.0 × 10⁶ nm. Magnification = image size ÷ actual size = 1.2 × 10⁵. In standard form the number before the power of ten is between 1 and 10. Electron micrographs of ribosomes need magnifications of around 100 000 because ribosomes are so small.

Mark scheme
  1. 1 mark

    Correct method: 3.0 × 10⁶ ÷ 25 (image converted to nm) OR 3.0 ÷ (25 × 10⁻⁶) (actual size converted to mm); or a correct final answer of 1.2 × 10⁵ with no working

    A correct answer of 1.2 × 10⁵ (accept × 1.2 × 10⁵) with no working scores 2 marks. Accept for 1 mark: 120 000 (correct but not in standard form) OR evidence of 3 000 000 nm or 3.0 × 10⁶ nm OR 2.5 × 10⁻⁵ mm. Do not credit 0.12 or 8.3 × 10⁻⁶.

  2. 1 mark

    1.2 × 10⁵

    Accept 1.2 × 10⁵ only (standard form). Ignore the unit 'times'.
Question 2

3 marks

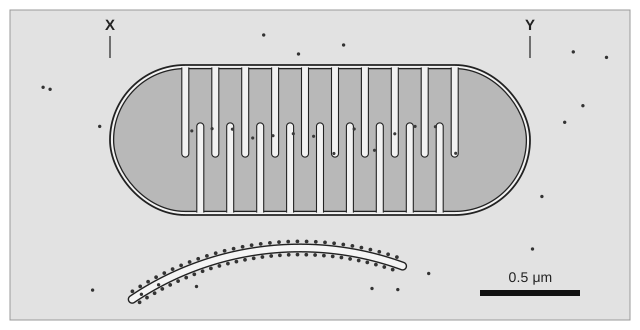
The figure shows a mitochondrion drawn from an electron micrograph, with a scale bar.

On a printed copy of the figure, the scale bar is 20 mm long and the mitochondrion is 84 mm long from X to Y.

Calculate the magnification of the figure. Use your answer to calculate the actual length of the mitochondrion from X to Y, in μm.

A drawing of a mitochondrion in the style of an electron micrograph: a long rounded organelle with a double outer membrane and many folds of the inner membrane reaching into a darker interior. Its left end is marked X and its right end Y. A curved sac studded with dots lies below it. A black scale bar at the bottom right is labelled 0.5 μm.

Model answer

Scale bar = 20 mm = 20 000 μm
Magnification = 20 000 ÷ 0.5 = × 40 000
Length X to Y = 84 mm = 84 000 μm
Actual length = 84 000 ÷ 40 000 = 2.1 μm

Explanation

Use the scale bar to find the magnification: its image length divided by the real length it represents, in the same unit (20 000 μm ÷ 0.5 μm = 40 000). Then actual size = image size ÷ magnification. A quick check: the mitochondrion is 84 ÷ 20 = 4.2 scale bars long, and 4.2 × 0.5 μm = 2.1 μm. Mitochondria are typically 1-5 μm long, so the answer is sensible.

Mark scheme
  1. 1 mark

    Magnification = × 40 000 (accept 4 × 10⁴): correct method 20 000 ÷ 0.5, or a correct magnification with no working

    A correct magnification of 40 000 with no working scores point 1. A correct length of 2.1 μm with no working scores points 2 and 3. Accept for point 1 only: evidence of 20 000 μm (scale bar converted). Do not credit 0.5 ÷ 20 000 or 40 (20 ÷ 0.5 without converting mm to μm) for point 1.

  2. 1 mark

    Correct method for length: 84 000 ÷ 40 000 OR 84 ÷ 20 × 0.5

    ECF: credit 84 000 ÷ (the candidate's magnification) for this point.

  3. 1 mark

    2.1 (μm)

    ECF from an incorrect magnification, if the method in point 2 is shown and the answer is in μm. Reject 0.0021 (mm) for this mark.

Question 3

4 marks

Describe how images are produced in a transmission electron microscope (TEM) and in a scanning electron microscope (SEM).

Explain why only the SEM produces a three-dimensional image.

Model answer

In a TEM, a beam of electrons is passed through a very thin section of the specimen. Denser parts, often stained with heavy metals, absorb or scatter more electrons and appear dark on the image, which is formed on a screen.

In an SEM, a beam of electrons is scanned across the surface of the specimen. Electrons are scattered and knocked off the surface, and a detector uses them to build up an image. Because the electrons come from the surface, the image shows the surface contours in three dimensions, whereas the TEM image is made from electrons that passed through a flat section, so it is two-dimensional.

Explanation

Both electron microscopes use a beam of electrons in a vacuum. The difference is where the electrons go: through a thin section in a TEM (giving a 2-D image of internal structure at the highest resolution) or off the surface in an SEM (giving a 3-D image of the surface at lower resolution). A common error is to say the TEM produces 3-D images.

Mark scheme
  1. 1 mark

    TEM: a beam of electrons passes through a (very) thin specimen/section

    Max 4. Reject 'light passes through' for TEM. Accept 'electrons are transmitted through the specimen'.

  2. 1 mark

    TEM: denser/stained parts absorb/scatter more electrons, so appear darker (on the image/screen)

    Accept 'electrons that pass through form an image on a screen or photographic plate'.

  3. 1 mark

    SEM: a beam of electrons is scanned/passed across the surface of the specimen

    Reject 'electrons pass through the specimen' for the SEM.

  4. 1 mark

    SEM: electrons are reflected/scattered/knocked off the surface (and detected to form the image)

    Accept 'bounce off the surface'.

  5. 1 mark

    SEM detects electrons from the surface (at different angles), so shows surface shape/contours in 3-D, but TEM electrons pass through, giving a flat/2-D image (of a section)

    Accept 3-D and 2-D. Both microscopes must be referred to for this mark.

Question 4

5 marks

Describe how a student could use an eyepiece graticule and a stage micrometer to find the actual length of a cell viewed with an optical microscope.

Model answer

Place the stage micrometer on the stage and focus on its scale. Rotate the eyepiece so that the graticule scale lies alongside the micrometer scale, with their zero lines together. Find a point where the two scales line up exactly and count the number of eyepiece divisions that correspond to a known length on the micrometer. Divide the known length by the number of eyepiece divisions to find the length of one division. Replace the micrometer with the slide of cells, measure the length of the cell in eyepiece divisions and multiply by the length of one division. Calibrate again whenever the objective lens is changed, and measure several cells to calculate a mean.

Explanation

The graticule is a scale in the eyepiece, so it stays the same size whatever the magnification, while the image of the specimen changes. It therefore has to be calibrated against a stage micrometer, which is a slide with a scale of known length (often 0.01 mm divisions), at each magnification. Answers often forget to recalibrate when the objective lens is changed.

Mark scheme
  1. 1 mark

    Put the stage micrometer on the stage (and focus on its scale)

    Points 1 to 8: 1 mark each, max 5.

  2. 1 mark

    Line up the eyepiece graticule scale with the stage micrometer scale (by rotating the eyepiece)

    Accept 'line up the zero/start of the two scales'.

  3. 1 mark

    Count the number of eyepiece divisions that match a known length/number of divisions on the stage micrometer

    Accept 'find where the two scales line up exactly'.

  4. 1 mark

    Calculate the length of one eyepiece division (known length ÷ number of eyepiece divisions)

    Accept a worked example, e.g. 40 divisions = 0.1 mm so 1 division = 2.5 μm.

  5. 1 mark

    Replace the micrometer with the slide and measure the length of the cell in eyepiece divisions

  6. 1 mark

    Multiply the number of eyepiece divisions by the calibrated length of one division

  7. 1 mark

    Recalibrate for each objective lens/magnification used

    Accept 'calibrate again if the magnification changes'.

  8. 1 mark

    Measure several cells (or measure the cell several times) and calculate a mean

    Accept 'repeat and calculate a mean'.

Ready to try the rest? Every answer you write is marked against the mark scheme, so you can see exactly where the marks are.

Study Helper Hints first, answers after you try

Stuck on this one? Ask for a hint and I’ll point you in the right direction, without giving the answer away. Once you’ve checked your answer, I’ll show you how the marks are awarded.