
Level:
Correct: 0
Incorrect: 0
Marks: 0/0
Exam Practice
Course:
Topics:
AQA A-Level Biology (Paper 1) Smart practice A mixed round aimed at your weak spots
Unit 1
Biological molecules
Unit 2
Cells
Unit 3
Organisms exchange substances with their environment
Unit 4
Genetic information, variation and relationships between organisms
DNA, genes and chromosomes
0%
Genetic diversity can arise as a result of mutation or during meiosis
Gene mutations and chromosome non-disjunction
0%
Meiosis and genetic variation
0%
Genetic diversity and adaptation
0%
Species and taxonomy
0%
Biodiversity within a community
0%
Investigating diversity
0%
Avg
score:
–
Topics
done:
0/35

Species and taxonomy

Practise 16 exam-style questions on Species and taxonomy for AQA A-Level Biology (Paper 1). Write your answer as you would in the exam and get it marked in seconds against the mark scheme, point by point, with the Study Helper on hand if you get stuck.

  • 16 questions
  • 1–7 marks each
  • Instant marking
  • No sign-up needed
16 questions, marked as you go

Sample questions with model answers

Here are 4 of the questions in this topic, each with a model answer, an explanation of why it earns the marks and the mark scheme an examiner would use.

Question 1

2 marks

The table shows how four species of mammal are classified.

Give the smallest taxon that contains all four species.

Use the table to explain whether the grey wolf is more closely related to the red fox or to the wildcat.
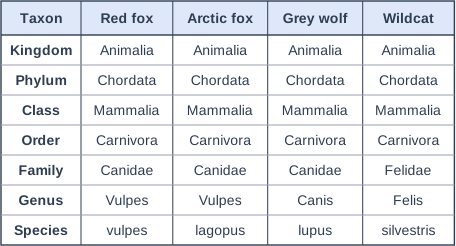
Table with columns "Taxon", "Red fox", "Arctic fox", "Grey wolf", "Wildcat". Taxon: Kingdom; Red fox: Animalia; Arctic fox: Animalia; Grey wolf: Animalia; Wildcat: Animalia | Taxon: Phylum; Red fox: Chordata; Arctic fox: Chordata; Grey wolf: Chordata; Wildcat: Chordata | Taxon: Class; Red fox: Mammalia; Arctic fox: Mammalia; Grey wolf: Mammalia; Wildcat: Mammalia | Taxon: Order; Red fox: Carnivora; Arctic fox: Carnivora; Grey wolf: Carnivora; Wildcat: Carnivora | Taxon: Family; Red fox: Canidae; Arctic fox: Canidae; Grey wolf: Canidae; Wildcat: Felidae | Taxon: Genus; Red fox: Vulpes; Arctic fox: Vulpes; Grey wolf: Canis; Wildcat: Felis | Taxon: Species; Red fox: vulpes; Arctic fox: lagopus; Grey wolf: lupus; Wildcat: silvestris.

Model answer

The smallest taxon containing all four species is the order Carnivora.

The grey wolf is more closely related to the red fox. They are in the same family (Canidae), but the wildcat is in a different family (Felidae), so the wolf and the red fox share a more recent common ancestor.

Explanation

In a phylogenetic classification, the more taxa two species share, the more recently they shared a common ancestor. All four species share kingdom, phylum, class and order; the wolf and fox also share a family, while the wildcat does not. The smallest shared taxon is the lowest row of the table in which all four entries are the same.

Mark scheme
  1. 1 mark

    Order (Carnivora)

    Accept Carnivora alone. Reject class / Mammalia.

  2. 1 mark

    Red fox, because the grey wolf and the red fox are in the same family (Canidae) but the wildcat is in a different family (Felidae), so the wolf and fox share a more recent common ancestor

    Both the family comparison and the idea of a more recent common ancestor (or of being more closely related through shared taxa) are needed. Ignore 'they look alike'.
Question 2

3 marks

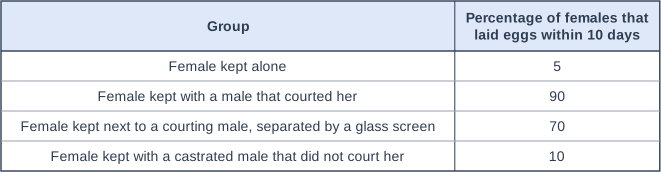
Scientists investigated the effect of courtship behaviour on egg laying in a species of dove. They divided female doves into four groups of 20 and recorded the percentage of females in each group that laid eggs within 10 days.

The table shows their results.

What do these results suggest about the role of courtship behaviour in doves? Use the data in your answer.

Table with columns "Group", "Percentage of females that laid eggs within 10 days". Group: Female kept alone; Percentage of females that laid eggs within 10 days: 5 | Group: Female kept with a male that courted her; Percentage of females that laid eggs within 10 days: 90 | Group: Female kept next to a courting male, separated by a glass screen; Percentage of females that laid eggs within 10 days: 70 | Group: Female kept with a castrated male that did not court her; Percentage of females that laid eggs within 10 days: 10.

Model answer

The results suggest that courtship stimulates the female to ovulate and lay eggs: 90% of females kept with a courting male laid eggs, compared with only 5% of females kept alone. It is the courtship behaviour that matters, not just the presence of a male, because only 10% laid eggs with a male that did not court. Seeing the courtship was enough for most females (70% behind a glass screen), so physical contact is not essential. Courtship therefore synchronises the female's readiness to mate with the male's.

Explanation

One role of courtship is to make sure both partners are sexually ready at the same time, for example by stimulating ovulation in the female. Compare each experimental group with the right control: alone against courting male (effect of courtship), the non-courting male (presence of a male without courtship) and the glass screen (sight without contact).

Mark scheme
  1. 1 mark

    Courtship (by the male) stimulates egg laying / ovulation in the female: 90% laid eggs with a courting male compared with 5% kept alone

    Max 2 if the answer does not use any figures from the table. Max 3 overall.

  2. 1 mark

    Seeing the courtship (behaviour) is enough to stimulate most females, without contact: 70% laid eggs behind the glass screen

    Accept 'physical contact is not essential but adds to the effect (70% compared with 90%)'.

  3. 1 mark

    The presence of a male alone (without courtship) has little effect: only 10% with the male that did not court

  4. 1 mark

    So courtship synchronises mating with ovulation / makes the female ready to mate at the same time as the male

    Accept 'courtship ensures the female is sexually ready / receptive when mating happens'.

Question 3

3 marks

Whales were traditionally classified in their own order, Cetacea. Camels, pigs, cows and hippopotamuses were classified together in a different order, Artiodactyla.

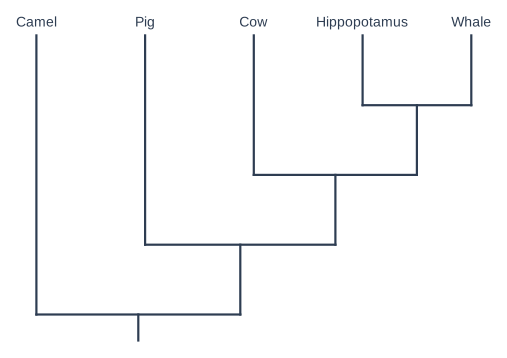
The figure shows a phylogenetic tree for these animals, based on comparisons of their DNA base sequences.

Use the tree to explain why many scientists now classify whales in the same order as camels, pigs, cows and hippopotamuses.

Evolutionary tree. The species are along the top, from left to right: Camel, Pig, Cow, Hippopotamus and Whale. The tree starts from a single line at the bottom, which splits into two branches: a line to Camel; a branch leading to Pig, Cow, Hippopotamus and Whale. The branch leading to Pig, Cow, Hippopotamus and Whale splits into two branches: a line to Pig; a branch leading to Cow, Hippopotamus and Whale. The branch leading to Cow, Hippopotamus and Whale splits into two branches: a line to Cow; a branch leading to Hippopotamus and Whale. Hippopotamus and Whale branch apart.

Model answer

The tree shows that whales and hippopotamuses share a more recent common ancestor with each other than hippopotamuses do with cows, pigs or camels, so whales are the closest relatives of hippopotamuses. A phylogenetic classification groups species according to their evolutionary relationships. If hippopotamuses are in the same order as camels, pigs and cows, then whales, which are even more closely related to hippopotamuses, must be in that order too.

Explanation

A phylogenetic classification should reflect common ancestry. DNA comparisons placed whales inside the group of even-toed hoofed mammals, next to hippopotamuses, so a classification that separates whales from hippopotamuses but keeps hippopotamuses with pigs and camels no longer matches the evidence. This is an example of genome sequencing clarifying evolutionary relationships.

Mark scheme
  1. 1 mark

    Whales and hippopotamuses share a more recent common ancestor (with each other) than hippopotamuses share with cows, pigs or camels / whales are the closest relatives of hippopotamuses

    Max 3.

  2. 1 mark

    So whales are more closely related to hippopotamuses than hippopotamuses are to camels / pigs / cows

  3. 1 mark

    Phylogenetic classification groups species by evolutionary relationships / common ancestry

    Accept 'classification should reflect evolutionary history'.

  4. 1 mark

    An order containing camels, pigs, cows and hippopotamuses must also contain whales / whales are within the group descended from the common ancestor of the other four (the hierarchy has no overlap)

    Accept 'if whales were in a separate order, the order Artiodactyla would not include all the descendants of its common ancestor'.

Question 4

6 marks

Advances in immunology and in genome sequencing have helped scientists to clarify the evolutionary relationships between organisms.

Explain how.

Model answer

Genome sequencing allows the base sequences of the DNA of different species to be compared. The fewer the differences in base sequence, the more closely related the species, because they share a more recent common ancestor and there has been less time for mutations to accumulate. Whole genomes, or many genes, can be compared, which gives much more evidence than observable features, which can look alike because of similar selection pressures.

In immunology, antibodies are produced against a protein from one species, for example by injecting its serum proteins into a rabbit. These antibodies are mixed with the same protein from other species. The more similar the protein's amino acid sequence and shape, the more antibodies bind and the more precipitate forms, so more precipitate shows the species are more closely related.

These methods are quantitative and have led to some species being reclassified.

Explanation

Both methods measure how much the molecules of two species differ, which reflects the time since their common ancestor. Genome sequencing compares DNA directly; immunology compares proteins using the specificity of antibodies. A complete answer explains each method and why its result shows relatedness, not just that the methods exist.

Mark scheme
  1. 1 mark

    Genome sequencing: the base sequences of DNA (genes / genomes) of different species are compared

    Max 4 if the answer describes only immunology or only genome sequencing. Max 6 overall.

  2. 1 mark

    The fewer the differences in base sequence, the more closely related the species

    Accept the converse.

  3. 1 mark

    Because closely related species share a more recent common ancestor, so there has been less time for mutations to accumulate

    Accept for immunology or for sequencing.

  4. 1 mark

    Whole genomes / many genes can be compared, giving more evidence than observable features (which may be similar through similar selection pressures)

    Accept 'more objective / quantitative than comparing appearance'.

  5. 1 mark

    Immunology: antibodies are made against a protein / serum proteins from one species

    Accept 'antiserum'.

  6. 1 mark

    These antibodies are mixed with the same protein / serum from other species

  7. 1 mark

    The more similar the protein (amino acid sequence / tertiary structure), the more antibodies bind / the more precipitate forms

    Accept 'more antigen-antibody complexes'.

  8. 1 mark

    More precipitate means the species are more closely related

  9. 1 mark

    This evidence has led to some species being reclassified / moved to different groups

    Accept a correct example, e.g. whales placed with hippopotamuses.

Ready to try the rest? Every answer you write is marked against the mark scheme, so you can see exactly where the marks are.

Study Helper Hints first, answers after you try

Stuck on this one? Ask for a hint and I’ll point you in the right direction, without giving the answer away. Once you’ve checked your answer, I’ll show you how the marks are awarded.