
Level:
Correct: 0
Incorrect: 0
Marks: 0/0
Exam Practice
Course:
Topics:
AQA A-Level Biology (Paper 2) Smart practice A mixed round aimed at your weak spots
Unit 5
Energy transfers in and between organisms
Unit 6
Organisms respond to changes in their internal and external environments
Stimuli, both internal and external, are detected and lead to a response
Survival and response
0%
Receptors
0%
Control of heart rate
0%
Skeletal muscles are stimulated to contract by nerves and act as effectors
Skeletal muscles and muscle contraction
0%
Unit 7
Genetics, populations, evolution and ecosystems
Unit 8
The control of gene expression
Alteration of the sequence of bases in DNA can alter the structure of proteins
Gene mutations and their effects on proteins
0%
Using genome projects
0%
Differences in DNA between individuals of the same species can be exploited
DNA probes, screening and genetic counselling
0%
Genetic fingerprinting
0%
Unit 9
Comprehension
Avg
score:
–
Topics
done:
0/34

The chi-squared test in genetic crosses

Practise 17 exam-style questions on The chi-squared test in genetic crosses for AQA A-Level Biology (Paper 2). Write your answer as you would in the exam and get it marked in seconds against the mark scheme, point by point, with the Study Helper on hand if you get stuck.

  • 17 questions
  • 1–8 marks each
  • Instant marking
  • No sign-up needed
17 questions, marked as you go

Sample questions with model answers

Here are 4 of the questions in this topic, each with a model answer, an explanation of why it earns the marks and the mark scheme an examiner would use.

Question 1

2 marks

A student plans to find out whether the numbers of tall and dwarf plants produced by a cross fit a 3 : 1 ratio. The student writes:

'I will convert my counts into percentages and use a Student's t-test to compare them with the expected percentages of 75% and 25%.'

Give two reasons why the student's plan is not appropriate.

Model answer

A Student's t-test compares the means of two sets of data, but these data are counts of plants in two categories, so a χ² test, which compares observed numbers with expected numbers, should be used.
The test must use the actual numbers counted, not percentages: the same percentages from 20 plants and from 2000 plants would give very different conclusions.

Explanation

The χ² test is used for frequencies (counts) in categories when there is an expected ratio, as in genetic crosses. The t-test compares two means. χ² values depend on the size of the sample, so always use the raw counts and calculate expected numbers from the total; percentages lose this information.

Mark scheme
  1. 1 mark

    A t-test compares two means, but these data are counts/frequencies in categories, so a χ² test (comparing observed with expected frequencies) should be used

    List rule: if more than two reasons are given, each wrong or contradictory extra reason cancels one correct reason. Accept 'the data are categorical/discrete' with the idea that χ² is the correct test.

  2. 1 mark

    The test must use the actual numbers counted, not percentages (because the significance depends on the sample size)

    Accept 'percentages hide the number of plants counted' or 'expected numbers must be calculated from the total counted'.
Question 2

3 marks

A student carried out a cross and expected the offspring to be in three phenotype classes in a 9 : 3 : 4 ratio.

Give the number of degrees of freedom she should use in a χ² test on her results. Explain how you worked it out.

Explain what is meant by the critical value of χ² at P = 0.05.

Model answer

Degrees of freedom = number of phenotype classes - 1 = 3 - 1 = 2.

The critical value at P = 0.05 is the value of χ² that would be reached or exceeded by chance only 5% of the time if the null hypothesis were true. If the calculated χ² is equal to or greater than it, the probability that the difference is due to chance is 5% or less, so the difference is significant.

Explanation

Degrees of freedom depend on the number of categories compared, not on the number of offspring counted. The critical value at P = 0.05 marks the point beyond which a difference this large is unlikely (5% or less) to happen by chance, so the null hypothesis is rejected.

Mark scheme
  1. 1 mark

    2 (degrees of freedom)

    Reject 3, 4 or 15.

  2. 1 mark

    Number of categories/phenotype classes - 1 (3 - 1)

    Reject 'number of offspring - 1'.

  3. 1 mark

    The value of χ² at or above which the probability that the difference (between observed and expected) is due to chance is 5% or less / a value that would be reached by chance only 5% of the time if the null hypothesis is true

    Accept 'if χ² is greater than the critical value the difference is significant'. Insufficient: 'the value you compare χ² with'.

Question 3

5 marks

In oats, hull colour is controlled by two genes on different chromosomes. A dominant allele, B, gives black hulls whatever alleles of the second gene are present. In plants with the genotype bb, the dominant allele G gives grey hulls and the genotype gg gives white hulls.

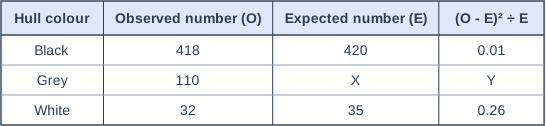
F1 plants that were heterozygous for both genes were self-pollinated. The table shows a χ² test on the F2 plants for a ratio of 12 black : 3 grey : 1 white.

Calculate the values of X and Y in the table. Give Y to 2 decimal places.

Calculate χ² for these results.

Use the critical values to give a conclusion.

Explain why the expected ratio is 12 : 3 : 1.

Critical values of χ² at P = 0.05:
1 degree of freedom: 3.84
2 degrees of freedom: 5.99
3 degrees of freedom: 7.82

Table with columns "Hull colour", "Observed number (O)", "Expected number (E)", "(O - E)² ÷ E". Hull colour: Black; Observed number (O): 418; Expected number (E): 420; (O - E)² ÷ E: 0.01 | Hull colour: Grey; Observed number (O): 110; Expected number (E): X; (O - E)² ÷ E: Y | Hull colour: White; Observed number (O): 32; Expected number (E): 35; (O - E)² ÷ E: 0.26.

Model answer

X = 560 × 3/16 = 105
Y = (110 - 105)²/105 = 25/105 = 0.24
χ² = 0.01 + 0.24 + 0.26 = 0.51

There are 3 categories, so 2 degrees of freedom; the critical value is 5.99. 0.51 is less than 5.99, so the difference between the observed and expected numbers is not significant: the results fit a 12 : 3 : 1 ratio.

The F1 plants are BbGg, so their offspring are 9 B_G_ : 3 B_gg : 3 bbG_ : 1 bbgg. B gives black hulls whatever alleles of gene G are present, so B_G_ and B_gg are all black (12/16); bbG_ plants are grey (3/16) and bbgg plants are white (1/16).

Explanation

In a partly completed χ² table, work along each row: E = total × fraction from the ratio, then (O - E)² ÷ E. Adding the last column gives χ². The 12 : 3 : 1 ratio is a 9 : 3 : 3 : 1 ratio with the first two classes combined, because a dominant allele of one gene hides the effect of the other gene (epistasis).

Mark scheme
  1. 1 mark

    X = 105 (a correct answer with no working scores this mark)

    560 × 3/16. A correct value of X with no working scores 1 mark, and a correct value of Y with no working scores point 2.

  2. 1 mark

    Y = 0.24 (a correct answer with no working scores this mark)

    Accept 0.238. Allow ECF from an incorrect X.

  3. 1 mark

    χ² = 0.51 (accept 0.50 to 0.51)

    Allow ECF: the sum of 0.01, the student's Y and 0.26.

  4. 1 mark

    2 degrees of freedom AND χ² is less than 5.99, so the difference is not significant / the results fit a 12 : 3 : 1 ratio

    Accept ECF from the student's χ². Reject 'the results are due to chance' or 'the results are (not) significant': the difference (between observed and expected numbers) is what may be due to chance.

  5. 1 mark

    All plants with at least one B allele are black (B is epistatic / masks gene G), so B_ = 12/16 (9 + 3), bbG_ = 3/16 grey and bbgg = 1/16 white

    Accept an equivalent explanation in words.

Question 4

6 marks

A student carried out a dihybrid cross and counted the offspring in each of four phenotype classes. She wants to find out whether her results fit a 9 : 3 : 3 : 1 ratio.

Describe how she should use the chi-squared test to do this, and how she should interpret the result. The formula is χ² = Σ(O - E)² ÷ E, where O is the observed number and E is the expected number.

Model answer

First she should state a null hypothesis: that there is no significant difference between her observed numbers and the numbers expected from a 9 : 3 : 3 : 1 ratio. She calculates the expected numbers by multiplying the total number of offspring by 9/16, 3/16, 3/16 and 1/16. For each class she calculates (O - E)² ÷ E, using the actual numbers counted, and adds the four values to get χ². There are four classes, so there are 3 degrees of freedom. She looks up the critical value at P = 0.05 for 3 degrees of freedom (7.82). If her χ² is equal to or greater than this, the probability that the difference between observed and expected numbers is due to chance is 5% or less, so the difference is significant and she rejects the null hypothesis. If χ² is less than the critical value, the difference is not significant, so she does not reject the null hypothesis and her results fit a 9 : 3 : 3 : 1 ratio.

Explanation

A full answer covers the null hypothesis, expected numbers, the calculation, degrees of freedom, the critical value at P = 0.05 and both possible conclusions. Degrees of freedom are the number of categories minus one, not the number of offspring. Conclusions should be about the difference between observed and expected numbers being, or not being, due to chance.

Mark scheme
  1. 1 mark

    State a null hypothesis: there is no (significant) difference between the observed numbers and the numbers expected from a 9 : 3 : 3 : 1 ratio

    Max 6.

  2. 1 mark

    Calculate the expected numbers: the total number of offspring × 9/16, 3/16, 3/16 and 1/16

    Accept a worked example.

  3. 1 mark

    For each class, subtract E from O, square it and divide by E

    Accept '(O - E)² ÷ E for each phenotype'.

  4. 1 mark

    Add the four values to give χ²

  5. 1 mark

    Degrees of freedom = number of classes - 1 = 3

  6. 1 mark

    Compare χ² with the critical value at P = 0.05 for 3 degrees of freedom (7.82) from a table

    Accept 'look up the critical value in a table for P = 0.05'.

  7. 1 mark

    If χ² is greater than (or equal to) the critical value, the difference is significant / the probability that it is due to chance is 5% or less, so reject the null hypothesis

    Reject 'the results are due to chance' or 'the results are (not) significant': the difference (between observed and expected numbers) is what may be due to chance.

  8. 1 mark

    If χ² is less than the critical value, the difference is not significant / probably due to chance, so the null hypothesis is not rejected (the results fit 9 : 3 : 3 : 1)

  9. 1 mark

    Use the actual numbers counted, not percentages or proportions

  10. 1 mark

    Use a large number of offspring (so that chance differences have less effect)

    Insufficient: 'repeat the cross' with no idea of more offspring.

Ready to try the rest? Every answer you write is marked against the mark scheme, so you can see exactly where the marks are.

Study Helper Hints first, answers after you try

Stuck on this one? Ask for a hint and I’ll point you in the right direction, without giving the answer away. Once you’ve checked your answer, I’ll show you how the marks are awarded.