
Level:
Correct: 0
Incorrect: 0
Marks: 0/0
Exam Practice
Course:
Topics:
AQA A-Level Biology (Paper 2) Smart practice A mixed round aimed at your weak spots
Unit 5
Energy transfers in and between organisms
Unit 6
Organisms respond to changes in their internal and external environments
Stimuli, both internal and external, are detected and lead to a response
Survival and response
0%
Receptors
0%
Control of heart rate
0%
Skeletal muscles are stimulated to contract by nerves and act as effectors
Skeletal muscles and muscle contraction
0%
Unit 7
Genetics, populations, evolution and ecosystems
Unit 8
The control of gene expression
Alteration of the sequence of bases in DNA can alter the structure of proteins
Gene mutations and their effects on proteins
0%
Using genome projects
0%
Differences in DNA between individuals of the same species can be exploited
DNA probes, screening and genetic counselling
0%
Genetic fingerprinting
0%
Unit 9
Comprehension
Avg
score:
–
Topics
done:
0/34

Control of blood glucose concentration

Practise 21 exam-style questions on Control of blood glucose concentration for AQA A-Level Biology (Paper 2). Write your answer as you would in the exam and get it marked in seconds against the mark scheme, point by point, with the Study Helper on hand if you get stuck.

  • 21 questions
  • 1–8 marks each
  • Instant marking
  • No sign-up needed
20 questions, marked as you go

Sample questions with model answers

Here are 4 of the questions in this topic, each with a model answer, an explanation of why it earns the marks and the mark scheme an examiner would use.

Question 1

3 marks

Glucagon is a polypeptide hormone. Liver cells respond to glucagon, but skeletal muscle cells do not.

Explain why.

Model answer

Glucagon is a large, polar polypeptide, so it cannot cross the phospholipid bilayer of the cell-surface membrane. It acts by binding to specific receptors on the cell-surface membrane, whose tertiary structure is complementary to glucagon. Liver cells have these receptors, but skeletal muscle cells do not, so only liver cells respond.

Explanation

Hormones affect only target cells that have the right receptor. Polypeptide hormones such as glucagon cannot pass through the phospholipid bilayer, so their receptors are on the cell-surface membrane and a second messenger carries the signal inside. A common error is to call the receptor an 'active site'.

Mark scheme
  1. 1 mark

    Glucagon is a large / polar / water-soluble molecule, so it cannot cross the phospholipid bilayer / cannot enter cells

    Max 3. Accept 'too large to diffuse through the membrane'.

  2. 1 mark

    So it acts by binding to receptors on the cell-surface membrane

    Accept 'it acts through a second messenger (cAMP) inside the cell'.

  3. 1 mark

    Liver cells have glucagon receptors but skeletal muscle cells do not

    Accept 'only target cells have the receptor'. Reject 'glycogen receptors' or 'glucose receptors' for glucagon receptors.

  4. 1 mark

    The receptor has a (specific) tertiary structure / shape that is complementary to glucagon

    Reject 'active site' for the receptor.
Question 2

3 marks

To make a glucose standard for a calibration curve, a student measured 0.40 cm³ of glucose solution with a 1 cm³ graduated pipette. The uncertainty of the pipette is ±0.01 cm³.

Calculate the percentage uncertainty in the volume of glucose solution.

A 10 cm³ measuring cylinder has an uncertainty of ±0.1 cm³. Use a calculation to explain why the measuring cylinder would be less suitable for measuring this volume.

Model answer

Percentage uncertainty = 0.01 ÷ 0.40 × 100 = 2.5%

With the measuring cylinder: 0.1 ÷ 0.40 × 100 = 25%. This is ten times larger, so the volume, and therefore the concentration of the standard, would be much less accurate.

Explanation

Percentage uncertainty = uncertainty ÷ value measured × 100. The smaller the volume measured, the larger the percentage uncertainty, so small volumes should be measured with apparatus that has a small uncertainty, such as a graduated pipette. Inaccurate standards make the whole calibration curve inaccurate.

Mark scheme
  1. 1 mark

    Correct method: 0.01 ÷ 0.40 × 100; or a correct final answer of 2.5 (%) with no working

    A correct answer of 2.5% with no working scores 2 marks (points 1 and 2). Accept for 1 mark: 0.025 (not multiplied by 100).

  2. 1 mark

    2.5 (%)

    Accept ±2.5%.

  3. 1 mark

    With the measuring cylinder the percentage uncertainty would be 25% (0.1 ÷ 0.40 × 100), ten times larger, so the concentration of the standard would be much less accurate

    The calculated 25% (or 'ten times larger', with the working) is needed for this mark.

Question 3

4 marks

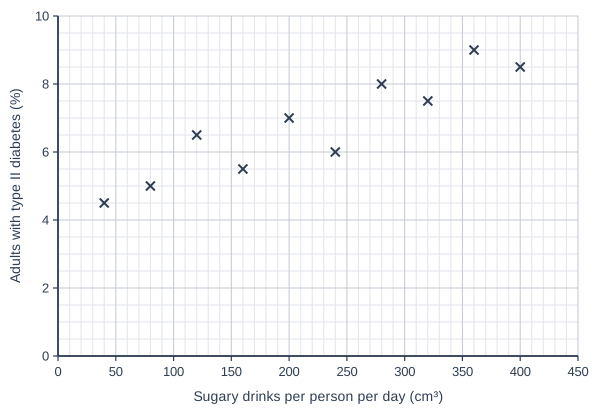
The graph shows the mean volume of sugary drinks consumed per person and the percentage of adults with type II diabetes in ten regions of a country.

- Health advisers say that sugary drinks are a major cause of the increase in type II diabetes and want a tax on these drinks.
- A food industry organisation says that type II diabetes is caused by being overweight and inactive, not by any one food, and that a tax would be unfair.

Use the graph and your own knowledge to evaluate these two positions.

Scatter graph on a grid of small squares. The horizontal axis is "Sugary drinks per person per day (cm³)", from 0 to 450, numbered every 50, with 5 small squares between numbered values (each small square is 10). The vertical axis is "Adults with type II diabetes (%)", from 0 to 10, numbered every 2, with 4 small squares between numbered values (each small square is 0.5). 10 points are plotted as crosses: (40, 4.5), (80, 5), (120, 6.5), (160, 5.5), (200, 7), (240, 6), (280, 8), (320, 7.5), (360, 9) and (400, 8.5).

Model answer

The graph shows a positive correlation: regions where more sugary drinks are consumed have a higher percentage of adults with type II diabetes, which supports the health advisers. However, correlation does not prove causation; the regions may also differ in obesity, overall diet, exercise or age. Sugary drinks provide a lot of sugar and energy and can contribute to obesity, which is a risk factor, so both positions may be partly right. There is also some scatter, so other factors must be involved, and the data are regional means, not measurements of individuals. The food industry organisation may be biased because it profits from the drinks, while the health advisers would need controlled studies to show that the drinks cause diabetes.

Explanation

To evaluate positions, weigh the evidence for and against each. A correlation between drink consumption and diabetes supports a link but cannot show cause, because other risk factors may vary with drink consumption. Consider who is making each claim and whether they might be biased, and what further evidence would be needed.

Mark scheme
  1. 1 mark

    There is a positive correlation between sugary drink consumption and the percentage of adults with type II diabetes, which supports the health advisers

    Max 3 if the answer does not refer to the graph. Max 4. Accept 'regions that drink more sugary drinks have more type II diabetes', with or without values.

  2. 1 mark

    Correlation does not show causation / other factors (e.g. obesity, overall diet, exercise, age) may differ between the regions

    Accept 'the graph does not show that the drinks cause diabetes'.

  3. 1 mark

    Sugary drinks provide a lot of sugar / energy, which can lead to obesity, a risk factor for type II diabetes, so both positions may be partly correct

    Accept 'the two positions are not incompatible'.

  4. 1 mark

    There is scatter / some regions with similar consumption have different percentages, so other factors must be involved

    Accept a correct example from the graph, e.g. 240 cm³ gives 6.0% but 200 cm³ gives 7.0%.

  5. 1 mark

    The data are means for regions, not individuals / do not show that the people who drink more are the ones with diabetes

  6. 1 mark

    The food industry organisation may be biased because it profits from selling sugary drinks

    Accept 'the food industry has a financial interest in the result'.

  7. 1 mark

    Controlled studies / experiments are needed to show that sugary drinks cause type II diabetes (e.g. comparing similar people who do and do not cut out sugary drinks)

    Accept 'the health advisers need experimental evidence, not just a correlation'.

Question 4

6 marks

Describe how insulin causes a decrease in the concentration of glucose in the blood.

Model answer

Insulin binds to specific receptors on the cell-surface membranes of target cells such as liver and muscle cells. This causes vesicles containing channel proteins for glucose to fuse with the cell-surface membrane, so more of these proteins are included in the membrane. The membrane becomes more permeable to glucose, so more glucose enters the cells by facilitated diffusion. Insulin also activates enzymes that convert glucose to glycogen (glycogenesis), which keeps the glucose concentration inside the cells low and maintains the concentration gradient for glucose to enter. It also increases the rate at which cells respire glucose or convert it to fat.

Explanation

The specification names three actions of insulin: binding to receptors on target cells, increasing the number of channel proteins for glucose in their membranes, and activating the enzymes of glycogenesis. Glucose then enters by facilitated diffusion, not active transport. Never write that insulin 'converts' glucose: it activates the enzymes that do.

Mark scheme
  1. 1 mark

    Insulin binds to (specific) receptors on the cell-surface membranes of target cells / liver and muscle cells

    Max 6. Reject 'binds to an active site'. Reject 'insulin enters the cell'. Reject confusions of glucose, glycogen and glucagon (e.g. 'glucagon is converted to glucose').

  2. 1 mark

    (Causes) vesicles containing channel / carrier proteins (for glucose) to fuse with the cell-surface membrane / more channel proteins are inserted into the membrane

    Accept GLUT / GLUT4 proteins, glucose transport proteins. Accept 'regulates the inclusion of channel proteins in the membrane'.

  3. 1 mark

    So the membrane is more permeable to glucose / more glucose enters cells

    Insufficient: 'cells take in more glucose' with no reference to the membrane or channel proteins, unless point 2 is awarded.

  4. 1 mark

    By facilitated diffusion

    Reject active transport or 'diffusion through the phospholipid bilayer'.

  5. 1 mark

    Activates enzymes that convert glucose to glycogen / activates enzymes for glycogenesis (in liver and muscle cells)

    Reject 'insulin converts glucose to glycogen' (insulin is not an enzyme). Reject glycogenolysis or gluconeogenesis for glycogenesis.

  6. 1 mark

    This keeps the glucose concentration inside cells low, maintaining a concentration gradient for glucose to enter

    Accept 'more glucose is converted to glycogen, so more can diffuse in'.

  7. 1 mark

    Glucose is used faster inside cells, e.g. respired faster or converted to lipid (fat)

    One mark only for this idea: accept 'increases the rate of respiration of glucose' or 'increases the conversion of glucose to fat'.

Ready to try the rest? Every answer you write is marked against the mark scheme, so you can see exactly where the marks are.

Study Helper Hints first, answers after you try

Stuck on this one? Ask for a hint and I’ll point you in the right direction, without giving the answer away. Once you’ve checked your answer, I’ll show you how the marks are awarded.