
Level:
Correct: 0
Incorrect: 0
Marks: 0/0
Exam Practice
Course:
Topics:
AQA A-Level Biology (Paper 2) Smart practice A mixed round aimed at your weak spots
Unit 5
Energy transfers in and between organisms
Unit 6
Organisms respond to changes in their internal and external environments
Stimuli, both internal and external, are detected and lead to a response
Survival and response
0%
Receptors
0%
Control of heart rate
0%
Skeletal muscles are stimulated to contract by nerves and act as effectors
Skeletal muscles and muscle contraction
0%
Unit 7
Genetics, populations, evolution and ecosystems
Unit 8
The control of gene expression
Alteration of the sequence of bases in DNA can alter the structure of proteins
Gene mutations and their effects on proteins
0%
Using genome projects
0%
Differences in DNA between individuals of the same species can be exploited
DNA probes, screening and genetic counselling
0%
Genetic fingerprinting
0%
Unit 9
Comprehension
Avg
score:
–
Topics
done:
0/34

Populations in ecosystems and population size

Practise 20 exam-style questions on Populations in ecosystems and population size for AQA A-Level Biology (Paper 2). Write your answer as you would in the exam and get it marked in seconds against the mark scheme, point by point, with the Study Helper on hand if you get stuck.

  • 20 questions
  • 1–9 marks each
  • Instant marking
  • No sign-up needed
20 questions, marked as you go

Sample questions with model answers

Here are 4 of the questions in this topic, each with a model answer, an explanation of why it earns the marks and the mark scheme an examiner would use.

Question 1

2 marks

A student used a point quadrat frame to estimate the percentage cover of heather on a moor. The frame holds 10 pins, which are lowered one at a time to the ground. She placed the frame at 15 random positions and recorded the number of pins that touched heather. In total, 87 pins touched heather.

Calculate the percentage cover of heather.

Give one advantage of using a point quadrat rather than estimating percentage cover by eye in a square quadrat.

Model answer

Total number of pins = 15 × 10 = 150
Percentage cover = 87 ÷ 150 × 100 = 58%

A point quadrat is more objective: each pin either touches heather or it does not, so different people get the same result, whereas estimating cover by eye depends on judgement.

Explanation

A point quadrat records 'hits' at fixed points; the percentage of all pins that touch a species estimates its percentage cover. Remember to divide by the total number of pins lowered (positions × pins per frame). Its main advantage is that it removes the subjective judgement involved in estimating cover by eye.

Mark scheme
  1. 1 mark

    58 (%) (87 ÷ 150 × 100); a correct answer of 58% with no working scores this mark

    A correct answer of 58% with no working scores this mark. Do not accept 580 or 5.8.

  2. 1 mark

    More objective / less subjective (each pin is either touching or not) / results more repeatable/reproducible between different people

    List rule: if more than one advantage is given, a wrong or contradictory extra answer cancels the correct one. Accept 'more precise for plants with small or thin leaves'. Ignore 'more accurate' unless explained.
Question 2

3 marks

A student estimated the number of buttercup plants in a meadow that measures 50 m by 40 m. She placed ten 0.5 m × 0.5 m quadrats at random positions in the meadow and counted the buttercups in each.

The numbers of buttercups in the first nine quadrats were:
4   9   6   0   11   5   8   3   7

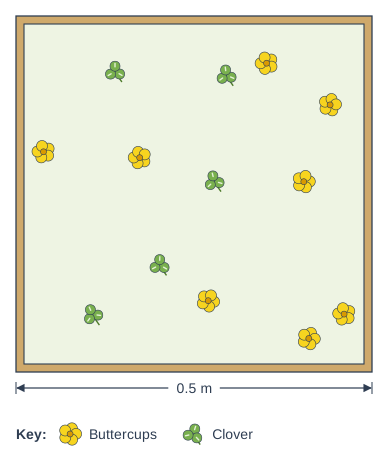
The figure shows her tenth quadrat.

Use all ten quadrats to estimate the number of buttercups in the meadow. Give your answer to 2 significant figures.

View from above of a square quadrat with sides marked 0.5 m. A key shows Buttercups as a yellow five-petalled flower and Clover as a three-lobed clover leaf. Buttercups: symbols scattered across the quadrat, which can be counted on the diagram. Clover: 5 symbols, scattered across the quadrat.

Model answer

Tenth quadrat = 8 buttercups
Total = 4 + 9 + 6 + 0 + 11 + 5 + 8 + 3 + 7 + 8 = 61
Mean = 61 ÷ 10 = 6.1 buttercups per quadrat
Area of a quadrat = 0.5 × 0.5 = 0.25 m², so mean density = 6.1 ÷ 0.25 = 24.4 per m²
Area of meadow = 50 × 40 = 2000 m²
Estimate = 24.4 × 2000 = 48 800 = 49 000 (2 significant figures)

Explanation

Population estimate = mean number per m² × total area. A 0.5 m quadrat has an area of 0.25 m², not 0.5 m², so the mean per quadrat must be multiplied by 4 (divided by 0.25) to give the number per m². Forgetting to convert the quadrat count to a density per m² is the most common error. Include the quadrat with no buttercups: it is part of the random sample.

Mark scheme
  1. 1 mark

    8 buttercups in the tenth quadrat (total 61) / mean of 6.1 per quadrat; or a correct final answer of 49 000 with no working

    A correct answer of 49 000 with no working scores 3 marks. Accept for 2 marks: 48 800 (correct but not to 2 significant figures) OR a correct method with an incorrect count for the tenth quadrat. Accept for 1 mark: 12 000 / 12 200 (mean per quadrat × area of the meadow, quadrat area not taken into account) OR evidence of 24.4 (mean number per m²).

  2. 1 mark

    Mean number per m² = 6.1 ÷ 0.25 = 24.4 / number of quadrats that fit in the meadow = 2000 ÷ 0.25 = 8000

    ECF from an incorrect count or mean.

  3. 1 mark

    49 000

    ECF: their mean per m² × 2000, given to 2 significant figures.

Question 3

4 marks

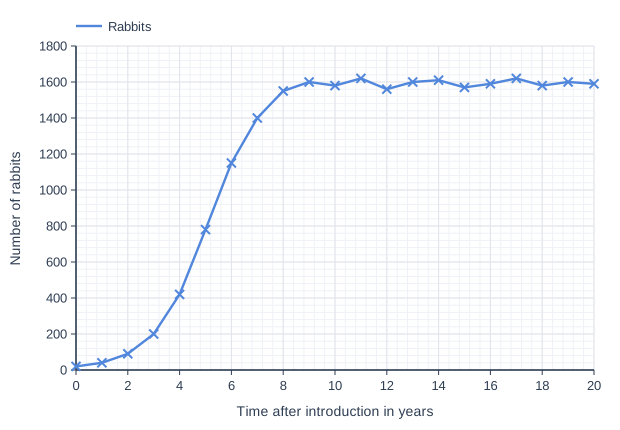
Rabbits were introduced to a small island that had no rabbits and no predators of rabbits. Ecologists estimated the number of rabbits on the island every year. The graph shows their results.

What is meant by the carrying capacity of an ecosystem?

Use the graph to estimate the carrying capacity of the island for rabbits.

Explain why the population stopped increasing.

Line graph of number of rabbits (y-axis, 0 to 1800) against time after introduction in years (x-axis, 0 to 20). "Rabbits" joins the points (0, 20), (1, 40), (2, 90), (3, 200), (4, 420), (5, 780), (6, 1150), (7, 1400), (8, 1550), (9, 1600), (10, 1580), (11, 1620), (12, 1560), (13, 1600), (14, 1610), (15, 1570), (16, 1590), (17, 1620), (18, 1580), (19, 1600), (20, 1590).

Model answer

The carrying capacity is the maximum population size of a species that an ecosystem can support.

From the graph, the population levelled off at about 1600 rabbits, so the carrying capacity is about 1600.

As the population grew, there was more intraspecific competition between rabbits for food and space. Fewer rabbits survived and reproduced, so the birth rate fell and the death rate rose until they were equal, and the population stopped increasing. With no predators, the size of the population was limited by the food available on the island.

Explanation

A population introduced to a new area with plentiful resources grows slowly at first, then rapidly, then levels off at the carrying capacity, where it fluctuates slightly. The levelling off is caused by limiting factors: here, with no predators, intraspecific competition for food and space. Read the plateau from the graph and give an approximate value rather than one point.

Mark scheme
  1. 1 mark

    Carrying capacity: the maximum (stable) population size of a species that an ecosystem can support (sustainably)

    Max 4. Accept 'the largest population the resources of the ecosystem can support'.

  2. 1 mark

    About 1600 rabbits (accept any value from 1550 to 1650)

    Accept a range within these limits, e.g. 'between 1560 and 1620'.

  3. 1 mark

    Intraspecific competition (between rabbits) for food/space/burrows increased as the population grew

    Reject interspecific competition. Insufficient: 'competition' unqualified unless food or space is named.

  4. 1 mark

    Birth rate fell and/or death rate rose until births equalled deaths (so the population stayed at about the same size)

    Accept 'fewer rabbits survive or reproduce when food is limited'.

  5. 1 mark

    (Population is limited by) food/resources available, because there is no predation

    Accept 'abiotic factors such as winter weather may also limit numbers'.

Question 4

5 marks

A conservation group wants to estimate the number of plants of a rare species of orchid in a meadow. The meadow measures 150 m by 80 m. The orchids are scattered across the whole meadow.

Describe how the group could estimate the number of orchids in the meadow.

Model answer

Lay two long tape measures at right angles along two edges of the meadow to make a grid. Use a random number generator to produce pairs of coordinates and place a 1 m × 1 m quadrat at each pair of coordinates. Count the number of orchids in each quadrat, using a key to make sure only this species is counted and counting plants on the edge only if more than half is inside. Place a large number of quadrats, at least 20, and calculate the mean number of orchids per quadrat. Divide the mean by the area of one quadrat to find the mean number per m², then multiply by the area of the meadow (150 × 80 = 12 000 m²) to estimate the total number of orchids.

Explanation

Randomly placed quadrats are used for non-motile organisms that are spread over an area, and random coordinates avoid bias in choosing where to sample. Many quadrats are needed for a representative mean. The step most often missed is the final calculation: the mean density per m² multiplied by the total area. 'Throwing' quadrats is not random, and 'scale up' without saying how does not score.

Mark scheme
  1. 1 mark

    Divide the meadow into a grid / lay two tape measures at right angles along two edges of the meadow

    Max 5. Accept 'use a map of the meadow divided into squares'.

  2. 1 mark

    Use random numbers (from a random number generator/table) to give coordinates for placing the quadrats

    Insufficient: 'place the quadrats randomly' with no method. Reject 'throw the quadrats'.

  3. 1 mark

    Count the number of orchids in each quadrat

    Ignore 'abundance' or 'percentage cover' for this mark.

  4. 1 mark

    Use a large number of quadrats (10 or more) and calculate the mean number of orchids per quadrat

    If a specific number is given, it must be 10 or more. Ignore 'several'.

  5. 1 mark

    Divide the mean by the area of a quadrat (to give the number per m²) and multiply by the area of the meadow (12 000 m²)

    Accept 'mean number per quadrat × number of quadrats that would fit in the meadow'. Insufficient: 'scale up' with no method.

  6. 1 mark

    Use a stated rule for plants on the edge of a quadrat (e.g. count a plant only if more than half of it is inside)

    Accept 'count plants touching two sides but not the other two'.

  7. 1 mark

    Use an identification key / guide to make sure only this species of orchid is counted

Ready to try the rest? Every answer you write is marked against the mark scheme, so you can see exactly where the marks are.

Study Helper Hints first, answers after you try

Stuck on this one? Ask for a hint and I’ll point you in the right direction, without giving the answer away. Once you’ve checked your answer, I’ll show you how the marks are awarded.