Practise 25 questions on Line graphs and conversion graphs for 11+ Maths. Tap your answer and find out straight away if you are right, with the Study Helper on hand if you get stuck.
25 questions
1–2 marks each
Instant marking
No sign-up needed
20 questions, marked as you go
Sample questions with model answers
Here are 4 of the questions in this topic, each with a model answer, an explanation of why it earns the marks and the mark scheme.
Question 1
1 mark
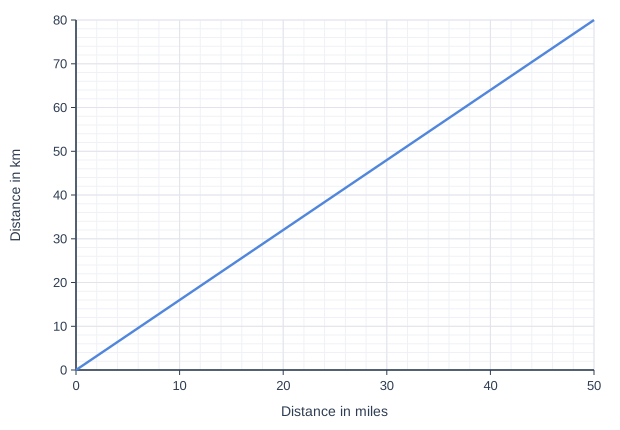
A road sign says it is 10 miles to the coast. The graph converts between miles and kilometres.
How far is it to the coast in kilometres?
Model answer
Go up from 10 miles to the line, then across to the kilometres axis. Each space between grid lines is worth 2 km. The line is 3 spaces above 10: \(10 + 3 \times 2 = 16\) km
Answer: 16 km
Explanation
Go up from 10 on the miles axis to the line, then across. On the kilometres axis each space between grid lines is worth 2. A mile is longer than a kilometre, so the number of kilometres is bigger.
Mark scheme
1 mark
16 km
Only 16 km. 10 km: assumes a mile is the same as a kilometre. 13 km: counts each space between grid lines as 1 instead of 2. 18 km: reads one grid line too high. 20 km: reads the numbered line above.
Question 2
1 mark
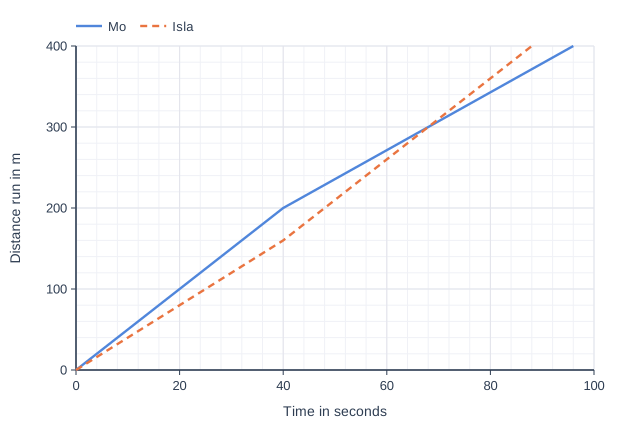
Mo and Isla ran a 400 m race. The graph shows how far each of them had run.
Who won the race, and by how many seconds?
Model answer
The finish is at 400 m. Read across from 400 m to each line and down to the time axis (each space between grid lines is 4 seconds). Isla reaches 400 m at 88 seconds. Mo reaches 400 m at 96 seconds. Isla finished first: \(96 - 88 = 8\) seconds ahead.
Answer: Isla, by 8 seconds
Explanation
The winner is the runner who reaches 400 m first, so compare the times where each line reaches 400 m. Mo was ahead early on, but Isla's line is steeper later and reaches the finish sooner. A common mistake is to judge the race from the start, where Mo was in front.
Mark scheme
1 mark
Isla, by 8 seconds
Only this answer: Isla, by 8 seconds. Isla, by 88 seconds: gives Isla's finishing time instead of the gap. Isla, by 2 seconds: counts the 2 small spaces between 88 and 96 as 1 second each instead of 4 seconds each. Isla, by 10 seconds: counts each space between grid lines as 5 seconds instead of 4, reading 90 and 100 seconds. Mo, by 8 seconds: finds the right gap but mixes up the two lines.
Question 3
1 mark
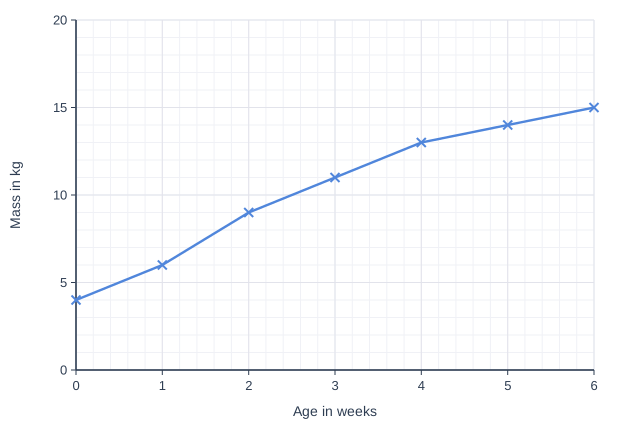
A farmer weighed a lamb each week from birth until it was 6 weeks old. The graph shows the results.
Which statement is true?
Model answer
Masses: 4, 6, 9, 11, 13, 14, 15 kg. Gains each week: 2, 3, 2, 2, 1, 1 kg. The biggest gain is 3 kg, between 1 and 2 weeks old.
Answer: The lamb gained the most mass between 1 week and 2 weeks old.
Explanation
The steepest part of the line shows the fastest gain. Check each statement against the readings: "gained" means the change in mass, not the mass itself. A common mistake is to give the final mass as the amount gained.
Mark scheme
1 mark
The lamb gained the most mass between 1 week and 2 weeks old.
Only this answer: The lamb gained the most mass between 1 week and 2 weeks old. The lamb gained 15 kg in its first 6 weeks: 15 kg is its mass at 6 weeks; it started at 4 kg, so it gained 11 kg. The lamb's mass did not change between 5 weeks and 6 weeks old: the line is less steep there, but it still rises from 14 kg to 15 kg. The lamb's mass doubled between 2 weeks and 4 weeks old: thinks the mass doubled because the age doubled; the mass went from 9 kg to 13 kg, which is not double. The lamb gained the most mass between 5 weeks and 6 weeks old: picks the highest part of the graph instead of the steepest.
Question 4
2 marks
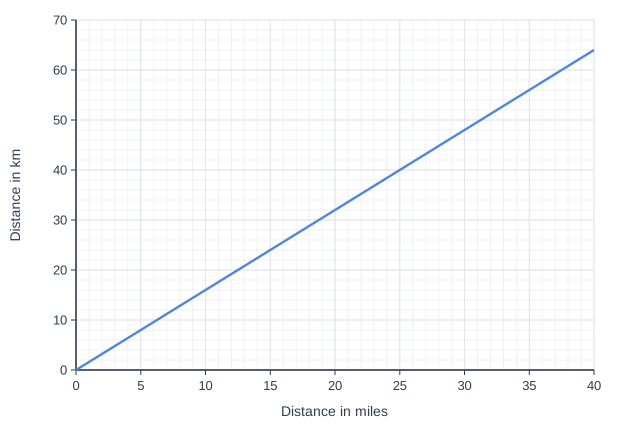
Ella's family drives 25 miles to the beach on Saturday and 35 miles to her gran's house on Sunday.
Use the conversion graph. How far is each journey in kilometres?
Model answer
Each space between grid lines on the miles axis is 1 mile, and on the kilometres axis 2 km. 25 miles: go up to the line and across: 40 km 35 miles: go up to the line and across: \(50 + 3 \times 2 = 56\) km
Answer: Saturday (km): 40 km Sunday (km): 56 km
Explanation
For each distance, go up from the miles axis to the line, then across to the kilometres axis. The two axes have different scales, so work out what each space is worth on each one. A common mistake is to read the kilometres scale as if each space were 1.
Mark scheme
1 mark
40 km
Do not accept 25 (the miles not changed into kilometres).
1 mark
56 km
Do not accept 35 (the miles not changed into kilometres) or 53 (each space on the kilometres axis counted as 1).
Ready to try the rest? Tap your answers and see straight away how you did.
Ctrl + Enter to check
Study HelperHints first, answers after you try
Stuck on this one? Ask for a hint and I’ll point you in the right direction, without giving the answer away. Once you’ve checked your answer, I’ll show you how the marks are awarded.