Practise 30 questions on Bar charts and pictograms for 11+ Maths. Tap your answer and find out straight away if you are right, with the Study Helper on hand if you get stuck.
30 questions
1–2 marks each
Instant marking
No sign-up needed
20 questions, marked as you go
Sample questions with model answers
Here are 4 of the questions in this topic, each with a model answer, an explanation of why it earns the marks and the mark scheme.
Question 1
1 mark
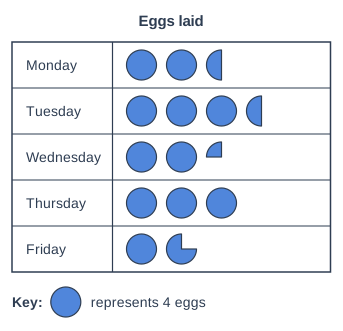
The pictogram shows the number of eggs laid by a school's hens each day.
How many eggs were laid on Tuesday?
Model answer
Tuesday has 3 whole circles and a half circle. 3 whole circles: \(3 \times 4 = 12\) eggs Half a circle: half of 4 is 2 eggs \(12 + 2 = 14\)
Answer: 14
Explanation
Each whole circle stands for 4 eggs, so half a circle stands for half of 4, which is 2. Add the whole circles and the part circle. A common mistake is to count the half circle as a whole one.
Mark scheme
1 mark
14
Do not accept 16 (the half circle counted as a whole circle) or 12 (the half circle left out).
Question 2
1 mark
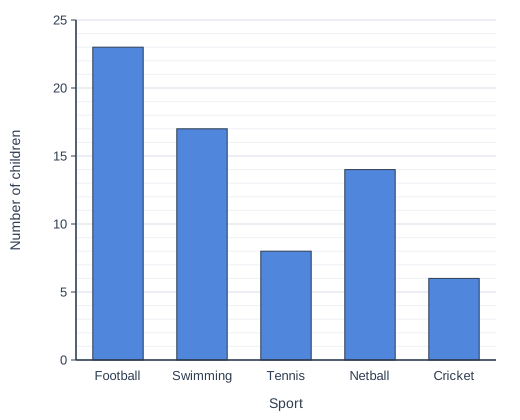
Every child in Year 5 chose their favourite sport. The bar chart shows the results.
How many children are in Year 5?
Model answer
Each grid line is worth 1. Football 23, swimming 17, tennis 8, netball 14, cricket 6 \(23 + 17 + 8 + 14 + 6 = 68\)
Answer: 68
Explanation
Every child chose one sport, so the number of children is the total of all the bars. Read each bar carefully on the scale, then add. A common mistake is to round each bar to the nearest numbered line.
Mark scheme
1 mark
68
Do not accept 5 (the number of sports), 70 (each bar rounded to the nearest 5) or 62 (cricket left out).
Question 3
1 mark
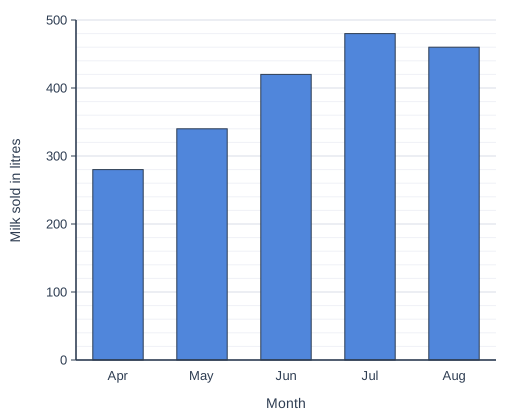
The bar chart shows how many litres of milk a dairy farm sold to the village shop each month.
How many fewer litres were sold in April than in August?
Model answer
The numbered lines go up in 100s with 5 small spaces between them, so each space between grid lines is worth 20. April: \(200 + 4 \times 20 = 280\) August: \(400 + 3 \times 20 = 460\) \(460 - 280 = 180\)
Answer: 180
Explanation
On this scale 100 is split into 5 small spaces, so each space between grid lines is worth 20. Read both bars and subtract. A common mistake is to count each grid line as 10.
Mark scheme
1 mark
180
Only 180. 160: reads August one grid line too low, as 440. 190: counts each grid line as 10 instead of 20, reading 240 and 430. 200: rounds each bar to the nearest 100 (500 − 300). 740: adds the two months instead of finding the difference.
Question 4
2 marks
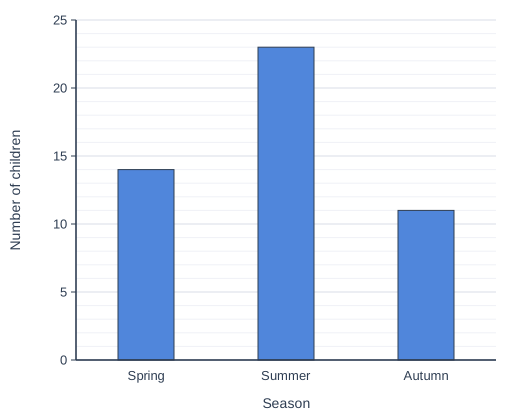
60 children chose their favourite season. The bar chart shows the results for spring, summer and autumn. The bar for winter has not been drawn.
How many children chose winter? How many more children chose summer than winter?
Answer: Children who chose winter: 12 How many more chose summer: 11
Explanation
All 60 children are in one of the four bars, so the missing bar is 60 take away the three bars shown. Then compare summer with winter. A common mistake is to give 48, the number of children already shown.
Mark scheme
1 mark
12
Do not accept 48 (the three seasons shown added).
1 mark
11
Follow through: 23 minus their number for winter.
Ready to try the rest? Tap your answers and see straight away how you did.
Ctrl + Enter to check
Study HelperHints first, answers after you try
Stuck on this one? Ask for a hint and I’ll point you in the right direction, without giving the answer away. Once you’ve checked your answer, I’ll show you how the marks are awarded.