Level:
Correct: 0
Incorrect: 0
Marks: 0/0
Exam Practice
Course:
Topics:
Edexcel GCSE Statistics (Higher Paper 1) Smart practice A mixed round aimed at your weak spots
Unit 1
The statistical enquiry cycle
Statistical enquiry cycle stages 1 and 2; (a) Planning: 1a.01, 1a.02, 1a.03
Statistical enquiry cycle: planning and collecting
Statistical enquiry cycle stages 3, 4 and 5
Statistical enquiry cycle: interpreting and evaluating
Unit 2
The collection of data
(b) Types of data: 1b.01, 1b.02, 1b.03
Types of data and variables
(b) Types of data: 1b.04; (d) Collecting data: 1d.01, 1d.02
Primary and secondary data, reliability and validity
(c) Population and sampling: 1c.01, 1c.02, 1c.03
Populations, sampling frames and non-random sampling
(c) Population and sampling: 1c.04, 1c.05
Random and systematic sampling
(c) Population and sampling: 1c.06
Stratified sampling
(d) Collecting data: 1d.05, 1d.06
Problems with collected data and cleaning data
Unit 3
Processing, representing and analysing data
(a) Tabulation, diagrams and representation: 2a.01
Tabulation, tallies, pictograms and two-way tables
(a) Tabulation, diagrams and representation: 2a.01, 2a.02
Pie charts and comparative pie charts
(a) Tabulation, diagrams and representation: 2a.01
Stem and leaf diagrams
(a) Tabulation, diagrams and representation: 2a.02
Population pyramids, choropleth maps and 2D and 3D diagrams
(a) Tabulation, diagrams and representation: 2a.04
Histograms and frequency density
(a) Tabulation, diagrams and representation: 2a.05, 2a.06, 2a.07, 2a.08
Choosing representations and misleading diagrams
(a) Tabulation, diagrams and representation: 2a.09, 2a.10
Skewness
(b) Measures of central tendency: 2b.01, 2b.02, 2b.03
Mode, median and mean
(b) Measures of central tendency: 2b.01
Weighted mean and geometric mean
(c) Measures of dispersion: 2c.01, 2c.06
Standard deviation and standardised scores
(a) Tabulation, diagrams and representation: 2a.03; (c) Measures of dispersion: 2c.02, 2c.03
Box plots and outliers
(b) Measures of central tendency: 2b.03; (c) Measures of dispersion: 2c.04, 2c.05
Comparing distributions
(d) Further summary statistics: 2d.01
Index numbers
(d) Further summary statistics: 2d.02
Rates of change
(e) Scatter diagrams and correlation: 2e.01, 2e.02, 2e.03
Scatter diagrams, correlation and causation
(e) Scatter diagrams and correlation: 2e.04
Lines of best fit and regression lines
(e) Scatter diagrams and correlation: 2e.05, 2e.06, 2e.07, 2e.08
Spearman's rank and product moment correlation coefficients
(f) Time series: 2f.01, 2f.02; (b) 2b.01 mean seasonal variation
Time series, moving averages and seasonal variation
(g) Quality assurance: 2g.01, 2g.02
Quality assurance and control charts
(h) Estimation: 2h.01, 2h.02, 2h.03
Estimation, sample size and capture-recapture
Unit 4
Probability
3. Probability: 3p.01, 3p.02, 3p.03, 3p.04
Probability, expected frequency and risk
3. Probability: 3p.05, 3p.06, 3p.10
Experimental and theoretical probability and bias
3. Probability: 3p.11
Binomial distribution
3. Probability: 3p.12, 3p.13
Normal distribution
Avg
score:
–
Topics
done:
0/40

Tabulation, tallies, pictograms and two-way tables

Practise 14 exam-style questions on Tabulation, tallies, pictograms and two-way tables for Edexcel GCSE Statistics (Higher Paper 1). Write your answer as you would in the exam and get it marked in seconds against the mark scheme, point by point, with the Study Helper on hand if you get stuck.

  • 14 questions
  • 1–5 marks each
  • Instant marking
  • No sign-up needed
14 questions, marked as you go

Sample questions with model answers

Here are 4 of the questions in this topic, each with a model answer, an explanation of why it earns the marks and the mark scheme an examiner would use.

Question 1

1 mark

The pictogram shows the number of bikes hired from a cycle hire shop on four days last week.

How many more bikes were hired on Thursday than on Wednesday?
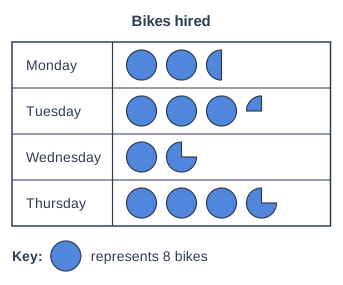
Pictogram titled "Bikes hired", a table with 4 rows of circle symbols. Key: one circle represents 8 bikes. Monday: 2 and a half circles. Tuesday: 3 and a quarter circles. Wednesday: 1 and three quarters circles. Thursday: 3 and three quarters circles.

Model answer

One circle represents 8 bikes.
Thursday: \(3\dfrac{3}{4} \times 8 = 30\) bikes
Wednesday: \(1\dfrac{3}{4} \times 8 = 14\) bikes
\(30 - 14 = 16\)

Answer: 16 more bikes

Explanation

Use the key: each whole circle is 8 bikes, so a quarter circle is 2 bikes. Thursday has exactly 2 more circles than Wednesday, which is \(2 \times 8 = 16\) bikes. Giving the number of extra symbols (2) instead of the number of bikes is the usual slip.

Mark scheme
  1. 1 mark

    B1 for 16

    cao. Thursday is 3 and three-quarter circles = 30 bikes; Wednesday is 1 and three-quarter circles = 14 bikes; 30 - 14 = 16 (or 2 more circles, \(2 \times 8 = 16\)). An answer of 2 (the number of extra circles) scores B0. Correct answer with no working scores the mark.
Question 2

2 marks

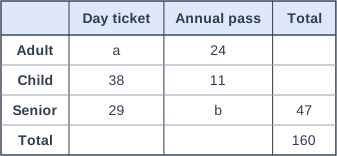
A museum recorded the type of ticket used by each of its 160 visitors on one Sunday. The two-way table shows some of this information.

Work out the value of a and the value of b.

Table with columns (row headings), "Day ticket", "Annual pass", "Total". Adult; Day ticket: a; Annual pass: 24; Total: (blank) | Child; Day ticket: 38; Annual pass: 11; Total: (blank) | Senior; Day ticket: 29; Annual pass: b; Total: 47 | Total; Day ticket: (blank); Annual pass: (blank); Total: 160.

Model answer

Senior: \(b = 47 - 29 = 18\)
Child total: \(38 + 11 = 49\)
Adult total: \(160 - 49 - 47 = 64\)
Adult day ticket: \(a = 64 - 24 = 40\)

a = 40, b = 18

Explanation

In a two-way table every row and every column adds up to its total, and the row totals (or the column totals) add up to the grand total. Find the row totals you can, then use the grand total of 160 to find the adult total before working out a. Check: the day ticket column is \(40 + 38 + 29 = 107\) and the annual pass column is \(24 + 11 + 18 = 53\), which add to 160.

Mark scheme
  1. 1 mark

    B1 for b = 18

    cao. \(47 - 29 = 18\). Answer-only rule for this question: Correct answers with no working score full marks.

  2. 1 mark

    B1 for a = 40

    cao. Children: \(38 + 11 = 49\); adults: \(160 - 49 - 47 = 64\); \(a = 64 - 24 = 40\). Common error: \(160 - 24 - 38 - 29 = 69\) (treating the table as if every cell were known) scores B0. Correct answers with no working score full marks.

Question 3

2 marks

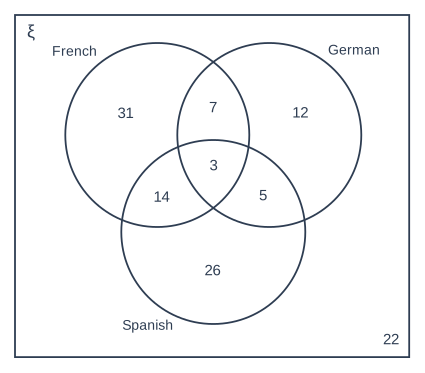
The Venn diagram shows the numbers of students in Year 10 at a school who study French, German and Spanish.

Work out the percentage of these students who study more than one of these three languages.
Give your answer correct to 1 decimal place.

A Venn diagram: a rectangle labelled ΞΎ (the universal set) containing three overlapping circles labelled "French", "German" and "Spanish", each overlapping the other two. The numbers written in each region are: in "French" only: 31; in "German" only: 12; in "Spanish" only: 26; in "French" and "German" but not "Spanish": 7; in "French" and "Spanish" but not "German": 14; in "German" and "Spanish" but not "French": 5; in all three: 3; outside all three circles: 22.

Model answer

Total number of students \(= 31 + 12 + 26 + 7 + 14 + 5 + 3 + 22 = 120\)
More than one language \(= 7 + 14 + 5 + 3 = 29\)
Percentage \(= \dfrac{29}{120} \times 100 = 24.166...\)

Answer: 24.2%

Explanation

'More than one' means the regions where circles overlap: the three regions for exactly two languages and the centre region for all three. The total must include the 22 students outside the circles, who study none of the languages. Forgetting the centre region or the outside region is the common error.

Mark scheme
  1. 1 mark

    M1 for \(\dfrac{7 + 14 + 5 + 3}{120}\) (\(\times 100\)) oe

    29 students study more than one language; the total is \(31 + 12 + 26 + 7 + 14 + 5 + 3 + 22 = 120\). Award for 29 seen with 120 used as the total. Leaving out the 3 in all three sets (26, 21.7%) or using 98 (the students who study at least one language) as the total (29.6%) scores M0A0. Answer-only rule for this question: Correct answer with no working scores 2 marks.

  2. 1 mark

    A1 for 24.2 (%)

    awrt 24.2, accept [24.15, 24.25]; exact value 24.166...%. 24% with correct working scores M1A0. Correct answer with no working scores 2 marks.

Question 4

4 marks

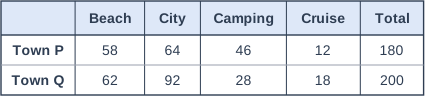
A travel company surveyed households in two towns, P and Q, about the main holiday each household took last year. The two-way table shows the results.

Olu makes two claims.

Claim 1: More households in Town Q than in Town P took a beach holiday.
Claim 2: Beach holidays were more popular in Town Q than in Town P.

Assess each of Olu's claims.
You must show your working.

Table with columns (row headings), "Beach", "City", "Camping", "Cruise", "Total". Town P; Beach: 58; City: 64; Camping: 46; Cruise: 12; Total: 180 | Town Q; Beach: 62; City: 92; Camping: 28; Cruise: 18; Total: 200.

Model answer

Claim 1: 62 households in Town Q and 58 households in Town P took a beach holiday. 62 > 58, so Claim 1 is correct.

Claim 2: different numbers of households were surveyed in the two towns, so compare proportions.
Town P: \(\dfrac{58}{180} \times 100 = 32.2\%\) took a beach holiday
Town Q: \(\dfrac{62}{200} \times 100 = 31\%\) took a beach holiday
31% < 32.2%, so a smaller proportion of Town Q's households took a beach holiday. Claim 2 is not correct: beach holidays were slightly more popular in Town P.

Explanation

When two groups have different totals (180 and 200 households here), the frequencies show which group has more beach holidays but not where beach holidays are more popular; for that, compare proportions or percentages. So both claims need a decision and a reason, and the second needs a calculation. A decision with no supporting values does not score.

Mark scheme
  1. 1 mark

    B1 for Claim 1 is correct, as 62 > 58

    Must give a decision (correct / true / yes) and refer to the numbers 62 and 58 (or say 4 more households in Town Q). A decision with no reason scores B0.

  2. 1 mark

    M1 for \(\dfrac{58}{180}\) or \(\dfrac{62}{200}\) oe

    As a fraction, decimal or percentage, eg 0.322 or 31%. Also allow a comparison of equivalent angles or proportions, eg \(\dfrac{58}{180} \times 360 = 116^\circ\) and \(\dfrac{62}{200} \times 360 = 111.6^\circ\).

  3. 1 mark

    A1 for 32.2(%) and 31(%) oe

    oe, eg 0.32 and 0.31, or awrt 32 and 31. Both values needed.

  4. 1 mark

    B1 for Claim 2 is not correct, as a smaller proportion of the households in Town Q took a beach holiday (31% < 32.2%) oe

    Dependent on the M1 (not on the A1); ft their proportions if the M1 is scored. Must give a decision and a comparison of proportions or percentages. 'Claim 2 is wrong because more households were surveyed in Town Q' with no proportions scores B0 (answer only scores 0: the question says you must show your working). Ignore extraneous non-contradictory comments.

Ready to try the rest? Every answer you write is marked against the mark scheme, so you can see exactly where the marks are.

Study Helper Hints first, answers after you try

Stuck on this one? Ask for a hint and I’ll point you in the right direction, without giving the answer away. Once you’ve checked your answer, I’ll show you how the marks are awarded.