Level:
Correct: 0
Incorrect: 0
Marks: 0/0
Exam Practice
Course:
Topics:
Edexcel GCSE Statistics (Higher Paper 1) Smart practice A mixed round aimed at your weak spots
Unit 1
The statistical enquiry cycle
Statistical enquiry cycle stages 1 and 2; (a) Planning: 1a.01, 1a.02, 1a.03
Statistical enquiry cycle: planning and collecting
Statistical enquiry cycle stages 3, 4 and 5
Statistical enquiry cycle: interpreting and evaluating
Unit 2
The collection of data
(b) Types of data: 1b.01, 1b.02, 1b.03
Types of data and variables
(b) Types of data: 1b.04; (d) Collecting data: 1d.01, 1d.02
Primary and secondary data, reliability and validity
(c) Population and sampling: 1c.01, 1c.02, 1c.03
Populations, sampling frames and non-random sampling
(c) Population and sampling: 1c.04, 1c.05
Random and systematic sampling
(c) Population and sampling: 1c.06
Stratified sampling
(d) Collecting data: 1d.05, 1d.06
Problems with collected data and cleaning data
Unit 3
Processing, representing and analysing data
(a) Tabulation, diagrams and representation: 2a.01
Tabulation, tallies, pictograms and two-way tables
(a) Tabulation, diagrams and representation: 2a.01, 2a.02
Pie charts and comparative pie charts
(a) Tabulation, diagrams and representation: 2a.01
Stem and leaf diagrams
(a) Tabulation, diagrams and representation: 2a.02
Population pyramids, choropleth maps and 2D and 3D diagrams
(a) Tabulation, diagrams and representation: 2a.04
Histograms and frequency density
(a) Tabulation, diagrams and representation: 2a.05, 2a.06, 2a.07, 2a.08
Choosing representations and misleading diagrams
(a) Tabulation, diagrams and representation: 2a.09, 2a.10
Skewness
(b) Measures of central tendency: 2b.01, 2b.02, 2b.03
Mode, median and mean
(b) Measures of central tendency: 2b.01
Weighted mean and geometric mean
(c) Measures of dispersion: 2c.01, 2c.06
Standard deviation and standardised scores
(a) Tabulation, diagrams and representation: 2a.03; (c) Measures of dispersion: 2c.02, 2c.03
Box plots and outliers
(b) Measures of central tendency: 2b.03; (c) Measures of dispersion: 2c.04, 2c.05
Comparing distributions
(d) Further summary statistics: 2d.01
Index numbers
(d) Further summary statistics: 2d.02
Rates of change
(e) Scatter diagrams and correlation: 2e.01, 2e.02, 2e.03
Scatter diagrams, correlation and causation
(e) Scatter diagrams and correlation: 2e.04
Lines of best fit and regression lines
(e) Scatter diagrams and correlation: 2e.05, 2e.06, 2e.07, 2e.08
Spearman's rank and product moment correlation coefficients
(f) Time series: 2f.01, 2f.02; (b) 2b.01 mean seasonal variation
Time series, moving averages and seasonal variation
(g) Quality assurance: 2g.01, 2g.02
Quality assurance and control charts
(h) Estimation: 2h.01, 2h.02, 2h.03
Estimation, sample size and capture-recapture
Unit 4
Probability
3. Probability: 3p.01, 3p.02, 3p.03, 3p.04
Probability, expected frequency and risk
3. Probability: 3p.05, 3p.06, 3p.10
Experimental and theoretical probability and bias
3. Probability: 3p.11
Binomial distribution
3. Probability: 3p.12, 3p.13
Normal distribution
Avg
score:
–
Topics
done:
0/40

Range, quartiles, percentiles and interpercentile ranges

Practise 14 exam-style questions on Range, quartiles, percentiles and interpercentile ranges for Edexcel GCSE Statistics (Higher Paper 1). Write your answer as you would in the exam and get it marked in seconds against the mark scheme, point by point, with the Study Helper on hand if you get stuck.

  • 14 questions
  • 1–5 marks each
  • Instant marking
  • No sign-up needed
14 questions, marked as you go

Sample questions with model answers

Here are 4 of the questions in this topic, each with a model answer, an explanation of why it earns the marks and the mark scheme an examiner would use.

Question 1

1 mark

A phone company tested 400 batteries of a new type. The 10th percentile of the battery lives was 18.6 hours.

Interpret this value in context.

Model answer

10% of the batteries tested lasted 18.6 hours or less (so 90% lasted longer than 18.6 hours).

Explanation

The pth percentile is the value that p% of the data are less than or equal to. An interpretation must say 'or less' (or 'or more' for the rest of the data) and be about the batteries: just saying that 10% lasted 18.6 hours loses the mark.

Mark scheme
  1. 1 mark

    B1 for 10% of the batteries lasted 18.6 hours or less / 90% of the batteries lasted 18.6 hours or more

    Accept 'less than', 'at most', 'up to' or 'no more than' for 'or less', and 'at least', 'longer than' or 'more than' for 'or more'. Accept 40 batteries (10% of 400) in place of 10%. Must be in context (the batteries or how long they lasted). B0 for '10% of the batteries lasted 18.6 hours' (no 'or less'), 'the 10th battery lasted 18.6 hours', or 'on average the batteries lasted 18.6 hours'.
Question 2

2 marks

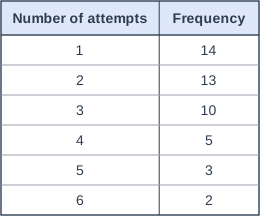
A driving school recorded the number of attempts that each of its 47 learners needed to pass the theory test. The table shows the results.

Work out the interquartile range of the numbers of attempts.

Table with columns "Number of attempts", "Frequency". Number of attempts: 1; Frequency: 14 | Number of attempts: 2; Frequency: 13 | Number of attempts: 3; Frequency: 10 | Number of attempts: 4; Frequency: 5 | Number of attempts: 5; Frequency: 3 | Number of attempts: 6; Frequency: 2.

Model answer

n = 47: lower quartile is the \(\dfrac{47 + 1}{4} = 12\)th value, upper quartile is the \(\dfrac{3(47 + 1)}{4} = 36\)th value.
Cumulative frequencies: 14, 27, 37, 42, 45, 47
12th value = 1, 36th value = 3
IQR = \(3 - 1 = 2\) attempts

Explanation

Use cumulative frequencies to find which number of attempts the 12th and 36th learners needed: the first 14 needed 1 attempt, and learners 28 to 37 needed 3. The IQR is the difference between the two values, not between their positions, which is a common error.

Mark scheme
  1. 1 mark

    M1 for identifying the lower quartile as 1 or the upper quartile as 3, eg the 12th and 36th values located using cumulative frequencies 14, 27, 37

    Either set of positions may be used: 11.75 and 35.25 (n/4 and 3n/4) or 12 and 36 ((n + 1)/4 and 3(n + 1)/4); every usual convention gives LQ = 1 and UQ = 3. Positions alone, without the value 1 or 3, do not score. Answer-only rule for this question: A correct answer with no working scores M1A1.

  2. 1 mark

    A1 for 2

    cao. A correct answer with no working scores M1A1. 5 (the range) scores M0A0. 24 (36 - 12, subtracting the positions instead of the values) scores M0A0.

Question 3

2 marks

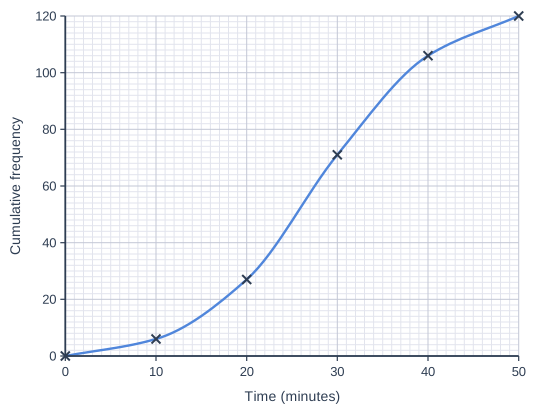
A school's revision website recorded how long, t minutes, each of 120 students spent on it one evening. The cumulative frequency graph gives information about these times.

Find an estimate for the interquartile range of the times.

Cumulative frequency graph on a grid of small squares. The horizontal axis is "Time (minutes)", from 0 to 50, numbered every 10, with 10 small squares between numbered values (each small square is 1). The vertical axis is "Cumulative frequency", from 0 to 120, numbered every 20, with 10 small squares between numbered values (each small square is 2). A smooth curve starts at (0, 0) and passes through (10, 6), (20, 27), (30, 71), (40, 106) and (50, 120) (each point is marked with a cross).

Model answer

n = 120, so read across at \(120 \div 4 = 30\) and \(3 \times 120 \div 4 = 90\).
Lower quartile: at cumulative frequency 30, t is about 20.9 minutes.
Upper quartile: at cumulative frequency 90, t is about 34.8 minutes.
IQR = \(34.8 - 20.9 = 13.9\) minutes

Explanation

For a cumulative frequency graph, read across at n/4 and 3n/4 (here 30 and 90) to the curve, then down to the time axis to find the lower and upper quartiles; the IQR is their difference. A common error is to subtract the cumulative frequencies (90 - 30 = 60) instead of the times.

Mark scheme
  1. 1 mark

    M1 for readings from the graph at cumulative frequencies 30 and 90, eg LQ in the range 20 to 22 or UQ in the range 34 to 36

    Accept readings at 30.25 and 90.75 ((n + 1) positions). Readings may be seen on the graph or in the working. Implied by an answer in the accepted range. Answer-only rule for this question: A correct answer with no working scores M1A1.

  2. 1 mark

    A1 for an answer in the range 12 to 16

    From readings in the ranges LQ 20 to 22 and UQ 34 to 36 (about one small square either side of the curve's values, 20.9 and 34.8). A correct answer with no working scores M1A1. 60 (90 - 30, subtracting cumulative frequencies) scores M0A0. 27.5 (the median) scores M0A0.

Question 4

4 marks

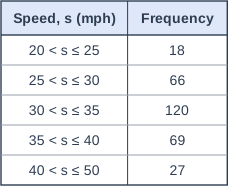
A council recorded the speeds, s mph, of 300 vehicles on a road next to a primary school. The table gives information about the speeds.

The council's rule is that traffic-calming measures are needed on a road if the 85th percentile of the speeds is more than 37 mph.

Use linear interpolation to decide whether traffic-calming measures are needed on this road.
Give your estimate of the 85th percentile correct to 1 decimal place.
You must show your working.

Table with columns "Speed, s (mph)", "Frequency". Speed, s (mph): 20 < s ≤ 25; Frequency: 18 | Speed, s (mph): 25 < s ≤ 30; Frequency: 66 | Speed, s (mph): 30 < s ≤ 35; Frequency: 120 | Speed, s (mph): 35 < s ≤ 40; Frequency: 69 | Speed, s (mph): 40 < s ≤ 50; Frequency: 27.

Model answer

85th percentile: \(0.85 \times 300 = 255\)th value
Cumulative frequencies: 18, 84, 204, 273, 300, so the 255th value is in the class 35 < s ≤ 40.
85th percentile = \(35 + \dfrac{255 - 204}{69} \times 5 = 35 + 3.69... = 38.7\) mph

38.7 mph > 37 mph, so traffic-calming measures are needed on this road.

Explanation

The pth percentile of grouped data is at position p% of n; find its class from the cumulative frequencies and interpolate across the class width (5 mph here). The class 35 to 40 mph contains 37 mph, so the class alone cannot answer the question - the interpolated value is needed. Finish with a clear decision that uses your value.

Mark scheme
  1. 1 mark

    M1 for \(0.85 \times 300\) (= 255) and identifying the class 35 < s ≤ 40

    Accept \(0.85 \times 301\) (= 255.85). eg cumulative frequencies 18, 84, 204, 273 seen with the 255th value located in 35 < s ≤ 40.

  2. 1 mark

    M1 for \(35 + \dfrac{255 - 204}{69} \times 5\) oe

    Accept 255.85 for 255. Also accept working down from the upper bound, eg \(40 - \dfrac{273 - 255}{69} \times 5\).

  3. 1 mark

    A1 for awrt 38.7, or awrt 38.8 if 255.85 is used

    Accept 38.696... or 38.757... or better. Answer only scores 0 (the question says you must show your working).

  4. 1 mark

    B1 for traffic-calming measures are needed because the (estimated) 85th percentile is more than 37 mph, eg 38.7 > 37

    Needs both M1 marks (not adjacent, so not marked dependent); ft their 85th percentile from a correct method. The decision must refer to a value of the 85th percentile (accept it rounded or unrounded). B0 for a decision based on the class 35 < s ≤ 40 alone.

Ready to try the rest? Every answer you write is marked against the mark scheme, so you can see exactly where the marks are.

Study Helper Hints first, answers after you try

Stuck on this one? Ask for a hint and I’ll point you in the right direction, without giving the answer away. Once you’ve checked your answer, I’ll show you how the marks are awarded.