
Level:
Correct: 0
Incorrect: 0
Marks: 0/0
Exam Practice
Course:
Topics:
Edexcel GCSE Statistics (Higher Paper 1) Smart practice A mixed round aimed at your weak spots
Unit 1
The statistical enquiry cycle
Statistical enquiry cycle stages 1 and 2; (a) Planning: 1a.01, 1a.02, 1a.03
Statistical enquiry cycle: planning and collecting
Statistical enquiry cycle stages 3, 4 and 5
Statistical enquiry cycle: interpreting and evaluating
Unit 2
The collection of data
(b) Types of data: 1b.01, 1b.02, 1b.03
Types of data and variables
(b) Types of data: 1b.04; (d) Collecting data: 1d.01, 1d.02
Primary and secondary data, reliability and validity
(c) Population and sampling: 1c.01, 1c.02, 1c.03
Populations, sampling frames and non-random sampling
(c) Population and sampling: 1c.04, 1c.05
Random and systematic sampling
(c) Population and sampling: 1c.06
Stratified sampling
(d) Collecting data: 1d.05, 1d.06
Problems with collected data and cleaning data
Unit 3
Processing, representing and analysing data
(a) Tabulation, diagrams and representation: 2a.01
Tabulation, tallies, pictograms and two-way tables
(a) Tabulation, diagrams and representation: 2a.01, 2a.02
Pie charts and comparative pie charts
(a) Tabulation, diagrams and representation: 2a.01
Stem and leaf diagrams
(a) Tabulation, diagrams and representation: 2a.02
Population pyramids, choropleth maps and 2D and 3D diagrams
(a) Tabulation, diagrams and representation: 2a.04
Histograms and frequency density
(a) Tabulation, diagrams and representation: 2a.05, 2a.06, 2a.07, 2a.08
Choosing representations and misleading diagrams
(a) Tabulation, diagrams and representation: 2a.09, 2a.10
Skewness
(b) Measures of central tendency: 2b.01, 2b.02, 2b.03
Mode, median and mean
(b) Measures of central tendency: 2b.01
Weighted mean and geometric mean
(c) Measures of dispersion: 2c.01, 2c.06
Standard deviation and standardised scores
(a) Tabulation, diagrams and representation: 2a.03; (c) Measures of dispersion: 2c.02, 2c.03
Box plots and outliers
(b) Measures of central tendency: 2b.03; (c) Measures of dispersion: 2c.04, 2c.05
Comparing distributions
(d) Further summary statistics: 2d.01
Index numbers
(d) Further summary statistics: 2d.02
Rates of change
(e) Scatter diagrams and correlation: 2e.01, 2e.02, 2e.03
Scatter diagrams, correlation and causation
(e) Scatter diagrams and correlation: 2e.04
Lines of best fit and regression lines
(e) Scatter diagrams and correlation: 2e.05, 2e.06, 2e.07, 2e.08
Spearman's rank and product moment correlation coefficients
(f) Time series: 2f.01, 2f.02; (b) 2b.01 mean seasonal variation
Time series, moving averages and seasonal variation
(g) Quality assurance: 2g.01, 2g.02
Quality assurance and control charts
(h) Estimation: 2h.01, 2h.02, 2h.03
Estimation, sample size and capture-recapture
Unit 4
Probability
3. Probability: 3p.01, 3p.02, 3p.03, 3p.04
Probability, expected frequency and risk
3. Probability: 3p.05, 3p.06, 3p.10
Experimental and theoretical probability and bias
3. Probability: 3p.11
Binomial distribution
3. Probability: 3p.12, 3p.13
Normal distribution
Avg
score:
–
Topics
done:
0/40

Statistical enquiry cycle: interpreting and evaluating

Practise 18 exam-style questions on Statistical enquiry cycle: interpreting and evaluating for Edexcel GCSE Statistics (Higher Paper 1). Write your answer as you would in the exam and get it marked in seconds against the mark scheme, point by point, with the Study Helper on hand if you get stuck.

  • 18 questions
  • 1–6 marks each
  • Instant marking
  • No sign-up needed
18 questions, marked as you go

Sample questions with model answers

Here are 4 of the questions in this topic, each with a model answer, an explanation of why it earns the marks and the mark scheme an examiner would use.

Question 1

1 mark

Ayo works in a school office. She recorded the number of hot lunches sold in the school canteen on each school day, for one term before and one term after a new menu was introduced.
The median number of hot lunches sold a day rose from 128 to 163. The interquartile range rose from 30 to 42.

Ayo will write one sentence about this in the newsletter for students.

Which of these sentences is the most suitable?

Choose your answer.

  • The median rose by 35 and the IQR rose by 12.
  • Hot lunch sales changed after the new menu.
  • Since the new menu started, about 35 more hot lunches are sold on a typical day.
  • Since the new menu started, 163 hot lunches have been sold every day.

Model answer

Since the new menu started, about 35 more hot lunches are sold on a typical day.

Explanation

Findings should be communicated clearly and concisely for their target audience. Students reading a newsletter need the main result in plain words and in context, without technical terms such as IQR. A median describes a typical day, not every day, so the last sentence claims more than the data show.

Mark scheme
  1. 1 mark

    B1 for 'Since the new menu started, about 35 more hot lunches are sold on a typical day.'

    Accept any clear indication of this option (e.g. 'the third one'). More than one option chosen scores B0. The first sentence uses technical terms (median, IQR) that many students will not understand and gives no context; the second is too vague to tell readers what happened; the fourth wrongly treats the median as the number sold on every day.
Question 2

2 marks

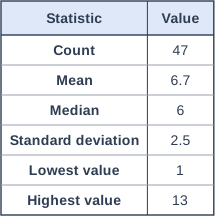
Mo asked 50 Year 10 students how many books they had read last term. He typed each answer into a spreadsheet and used statistical software to summarise the data.
The table shows the software output.

Explain why the count in the output may be 47 and not 50.
Describe what Mo should do before he uses these statistics.

Table with columns "Statistic", "Value". Statistic: Count; Value: 47 | Statistic: Mean; Value: 6.7 | Statistic: Median; Value: 6 | Statistic: Standard deviation; Value: 2.5 | Statistic: Lowest value; Value: 1 | Statistic: Highest value; Value: 13.

Model answer

Three of the 50 answers are probably missing or were typed in a form the software cannot read, such as a blank cell or a word ('three' or 'n/a'), so the software ignored them and used only 47 values.
Before using the statistics, Mo should check the spreadsheet for these three entries and correct them where he can (for example retype 'three' as 3), then run the summary again. If any answers are really missing, he should say that the statistics are based on 47 students.

Explanation

Software output has to be read with care: the count shows how many values were actually used. Blank cells and text are usually skipped without warning, so a count lower than expected is a sign that the data need cleaning. Correcting the entries, or reporting the true sample size, keeps the findings honest.

Mark scheme
  1. 1 mark

    B1 for three of the answers are missing (blank cells, e.g. students who did not answer) or were typed in a form the software cannot read (e.g. as words such as 'three', or 'n/a'), so the software has left them out

    oe. Accept 'three students did not give an answer' or 'three values are not numbers'. B0 for 'three students were absent' with no link to the data in the spreadsheet; B0 for 'the software made a mistake'.

  2. 1 mark

    B1 for checking the spreadsheet to find the three entries and correcting them where possible (e.g. retyping 'three' as 3), or else stating in his report that the statistics are based on 47 students

    oe. Accept 'clean the data' only with a description of what to look for. B0 for 'delete the three students' with no check, or for 'use 50 in the calculations'.

Question 3

3 marks

A holiday park asked guests to rate their stay as 'Excellent', 'Good' or 'Fair or poor'.
The park's hypothesis is

'A greater proportion of guests who booked online rated their stay as Excellent than guests who booked by phone.'

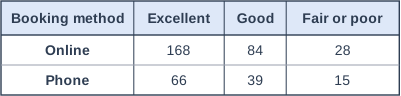
The table shows the ratings given by a sample of guests.

Do the data support the hypothesis? You must show your working.

Table with columns "Booking method", "Excellent", "Good", "Fair or poor". Booking method: Online; Excellent: 168; Good: 84; Fair or poor: 28 | Booking method: Phone; Excellent: 66; Good: 39; Fair or poor: 15.

Model answer

Online: 168 + 84 + 28 = 280 guests; 168 divided by 280 = 0.6 = 60%
Phone: 66 + 39 + 15 = 120 guests; 66 divided by 120 = 0.55 = 55%
60% > 55%, so yes: a greater proportion of guests who booked online rated their stay as Excellent, which supports the hypothesis.

Explanation

The hypothesis is about proportions, so each group's Excellent count must be divided by that group's total. Comparing 168 with 66 is a common error: far more guests booked online, so their count is bound to be larger. The conclusion should then refer back to the hypothesis using the two proportions.

Mark scheme
  1. 1 mark

    M1 for a correct method to find the proportion rating Excellent for one booking method, e.g. 168 divided by (168 + 84 + 28) or 66 divided by (66 + 39 + 15)

    Accept 168/280 or 66/120 in any form. Also accept the equivalent method using the proportions not rating Excellent, e.g. (84 + 28)/280 or (39 + 15)/120. Comparing the counts 168 and 66 scores 0. Answer only scores 0 (the question requires working).

  2. 1 mark

    A1 for both proportions correct: online 0.6 (60%) and phone 0.55 (55%)

    oe, e.g. 168/280 and 66/120, or 3/5 and 11/20. Accept the proportions not rating Excellent, 0.4 (40%) and 0.45 (45%).

  3. 1 mark

    B1 for yes, the data support the hypothesis, because 60% of online bookers rated their stay Excellent compared with 55% of phone bookers

    ft their two proportions if M1 was awarded (the conclusion must be consistent with their values). The decision must be supported by a comparison of proportions or percentages, not counts. Ignore comments that the difference is small, or about reliability.

Question 4

4 marks

Rafi works at a country park. His hypothesis is

'The more hours of daylight there are in a month, the more visitors the park has.'

He used the park's records of the number of visitors in each month of last year, and the mean number of hours of daylight per day in each month.
A scatter diagram of his data shows positive correlation, so he concludes that his hypothesis is true.

Describe two ways Rafi could refine his investigation to give clearer evidence about his hypothesis.
Give a reason for each.

Model answer

1. Take account of school holidays and the weather, for example by also recording the temperature, rainfall and number of school-holiday days in each month. The summer months have more daylight but also more holidays and warmer weather, so the correlation may not be caused by daylight.
2. Use data from several years instead of just one. Last year may have been unusual (for example a very wet summer), and more data points would make the result more reliable.

Explanation

Refining an investigation means changing the process to get clearer evidence about the original hypothesis. Here a third variable (holidays or weather) could explain the correlation, and one year of monthly data gives only 12 points. Good refinements either control or measure extraneous variables, or collect more and better data, and each one should be explained.

Mark scheme
  1. 2 marks

    B2 for a first refinement with a valid reason (B1 for a refinement without a valid reason)

    Refinements and reasons include: (1) use data from several years - last year may have been unusual / more data points make the result more reliable; (2) take account of other variables such as school holidays, temperature or rainfall (e.g. record them, or compare months with similar weather or holidays) - summer months also have holidays and warmer weather, so the correlation may not be due to daylight; (3) use daily or weekly data instead of monthly totals - many more data points, and it allows for months having different numbers of days; (4) use the mean number of visitors per day in each month - months have different numbers of days, so totals are not comparable; (5) collect data from other country parks - to see whether the relationship holds elsewhere; (6) calculate a correlation coefficient (e.g. Spearman's rank) - to measure the strength of the correlation rather than judge it by eye. B0 for 'collect more data' with no detail of what data. B0 for 'draw a line of best fit' alone.

  2. 2 marks

    B2 for a second, different refinement with a valid reason (B1 for a refinement without a valid reason)

    Use the list in the first mark point. The second refinement must be different from the first ((3) and (4) count as different only if both are clearly described).

Ready to try the rest? Every answer you write is marked against the mark scheme, so you can see exactly where the marks are.

Study Helper Hints first, answers after you try

Stuck on this one? Ask for a hint and I’ll point you in the right direction, without giving the answer away. Once you’ve checked your answer, I’ll show you how the marks are awarded.