Level:
Correct: 0
Incorrect: 0
Marks: 0/0
Exam Practice
Course:
Topics:
Edexcel GCSE Statistics (Higher Paper 1) Smart practice A mixed round aimed at your weak spots
Unit 1
The statistical enquiry cycle
Statistical enquiry cycle stages 1 and 2; (a) Planning: 1a.01, 1a.02, 1a.03
Statistical enquiry cycle: planning and collecting
Statistical enquiry cycle stages 3, 4 and 5
Statistical enquiry cycle: interpreting and evaluating
Unit 2
The collection of data
(b) Types of data: 1b.01, 1b.02, 1b.03
Types of data and variables
(b) Types of data: 1b.04; (d) Collecting data: 1d.01, 1d.02
Primary and secondary data, reliability and validity
(c) Population and sampling: 1c.01, 1c.02, 1c.03
Populations, sampling frames and non-random sampling
(c) Population and sampling: 1c.04, 1c.05
Random and systematic sampling
(c) Population and sampling: 1c.06
Stratified sampling
(d) Collecting data: 1d.05, 1d.06
Problems with collected data and cleaning data
Unit 3
Processing, representing and analysing data
(a) Tabulation, diagrams and representation: 2a.01
Tabulation, tallies, pictograms and two-way tables
(a) Tabulation, diagrams and representation: 2a.01, 2a.02
Pie charts and comparative pie charts
(a) Tabulation, diagrams and representation: 2a.01
Stem and leaf diagrams
(a) Tabulation, diagrams and representation: 2a.02
Population pyramids, choropleth maps and 2D and 3D diagrams
(a) Tabulation, diagrams and representation: 2a.04
Histograms and frequency density
(a) Tabulation, diagrams and representation: 2a.05, 2a.06, 2a.07, 2a.08
Choosing representations and misleading diagrams
(a) Tabulation, diagrams and representation: 2a.09, 2a.10
Skewness
(b) Measures of central tendency: 2b.01, 2b.02, 2b.03
Mode, median and mean
(b) Measures of central tendency: 2b.01
Weighted mean and geometric mean
(c) Measures of dispersion: 2c.01, 2c.06
Standard deviation and standardised scores
(a) Tabulation, diagrams and representation: 2a.03; (c) Measures of dispersion: 2c.02, 2c.03
Box plots and outliers
(b) Measures of central tendency: 2b.03; (c) Measures of dispersion: 2c.04, 2c.05
Comparing distributions
(d) Further summary statistics: 2d.01
Index numbers
(d) Further summary statistics: 2d.02
Rates of change
(e) Scatter diagrams and correlation: 2e.01, 2e.02, 2e.03
Scatter diagrams, correlation and causation
(e) Scatter diagrams and correlation: 2e.04
Lines of best fit and regression lines
(e) Scatter diagrams and correlation: 2e.05, 2e.06, 2e.07, 2e.08
Spearman's rank and product moment correlation coefficients
(f) Time series: 2f.01, 2f.02; (b) 2b.01 mean seasonal variation
Time series, moving averages and seasonal variation
(g) Quality assurance: 2g.01, 2g.02
Quality assurance and control charts
(h) Estimation: 2h.01, 2h.02, 2h.03
Estimation, sample size and capture-recapture
Unit 4
Probability
3. Probability: 3p.01, 3p.02, 3p.03, 3p.04
Probability, expected frequency and risk
3. Probability: 3p.05, 3p.06, 3p.10
Experimental and theoretical probability and bias
3. Probability: 3p.11
Binomial distribution
3. Probability: 3p.12, 3p.13
Normal distribution
Avg
score:
–
Topics
done:
0/40

Population pyramids, choropleth maps and 2D and 3D diagrams

Practise 14 exam-style questions on Population pyramids, choropleth maps and 2D and 3D diagrams for Edexcel GCSE Statistics (Higher Paper 1). Write your answer as you would in the exam and get it marked in seconds against the mark scheme, point by point, with the Study Helper on hand if you get stuck.

  • 14 questions
  • 1–5 marks each
  • Instant marking
  • No sign-up needed
14 questions, marked as you go

Sample questions with model answers

Here are 4 of the questions in this topic, each with a model answer, an explanation of why it earns the marks and the mark scheme an examiner would use.

Question 1

1 mark

County W has nine districts. In the choropleth map, the shade of each district shows the percentage of its homes that have solar panels. District H has not been shaded yet.

District B and District E are shaded in the same way.

Explain why the percentage of homes with solar panels in District B may not be the same as the percentage in District E.
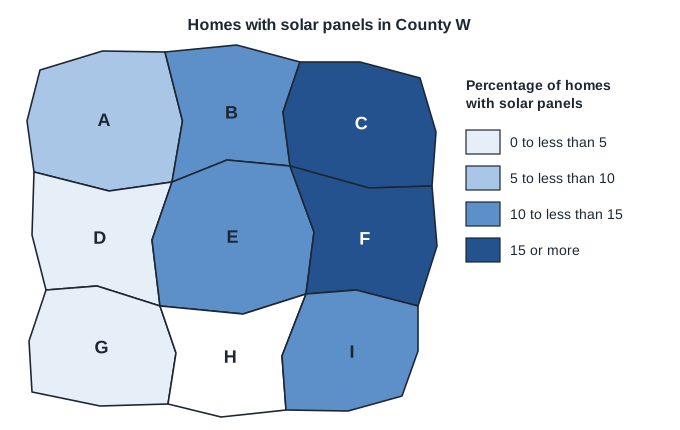
Choropleth map titled 'Homes with solar panels in County W'. The county is divided into nine districts labelled A to I, roughly in three rows: A, B and C across the top, from left to right; D, E and F in the middle; G, H and I across the bottom. Each district is shaded using the key 'Percentage of homes with solar panels', which has four shades from lightest to darkest: 0 to less than 5, 5 to less than 10, 10 to less than 15, 15 or more. District A: 5 to less than 10. District B: 10 to less than 15. District C: 15 or more. District D: 0 to less than 5. District E: 10 to less than 15. District F: 15 or more. District G: 0 to less than 5. District H: not shaded (white). District I: 10 to less than 15.

Model answer

Each shade stands for a class of percentages, not one value. B and E are both shaded '10 to less than 15', so, for example, B could be 10.5% and E could be 14.5%.

Explanation

A choropleth map groups the values into classes and gives each class a shade, so the exact value for an area is lost. Two areas with the same shade only have values somewhere in the same class. Answers about the numbers of homes miss the point, because the shading shows percentages.

Mark scheme
  1. 1 mark

    B1 for the shading shows a range (class) of percentages, 10% to less than 15%, not the exact percentage oe

    oe, eg 'B could be 10% and E could be 14%', 'the key is in intervals', 'the data is grouped'. B0 for 'the districts may have different numbers of homes' or 'we don't know the totals' (the shading shows percentages, so totals are not the reason). B0 for 'the map is not accurate' or 'the shades look different'.
Question 2

2 marks

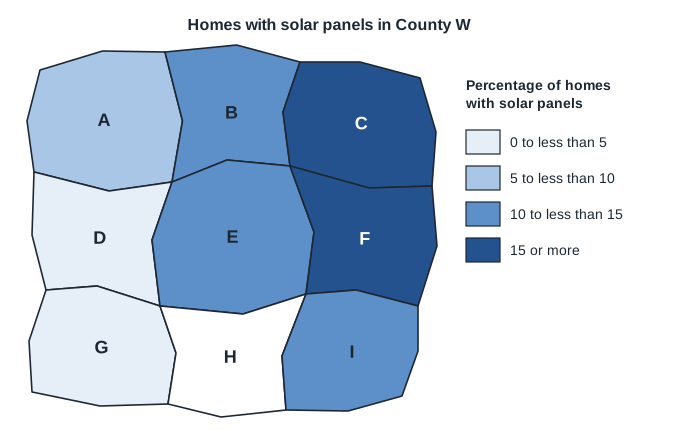
Leah is making a choropleth map of the percentage of homes with solar panels in each of the nine districts of County W. She has not yet shaded District H.

In District H, 1158 of the 9650 homes have solar panels.

Which class of the key does District H belong to?
You must show your working.

Choropleth map titled 'Homes with solar panels in County W'. The county is divided into nine districts labelled A to I, roughly in three rows: A, B and C across the top, from left to right; D, E and F in the middle; G, H and I across the bottom. Each district is shaded using the key 'Percentage of homes with solar panels', which has four shades from lightest to darkest: 0 to less than 5, 5 to less than 10, 10 to less than 15, 15 or more. District A: 5 to less than 10. District B: 10 to less than 15. District C: 15 or more. District D: 0 to less than 5. District E: 10 to less than 15. District F: 15 or more. District G: 0 to less than 5. District H: not shaded (white). District I: 10 to less than 15.

Model answer

Percentage of homes in District H with solar panels \(= \dfrac{1158}{9650} \times 100 = 12\%\)
12% is in the class '10 to less than 15', so District H should have the same shade as Districts B, E and I.

Explanation

Each district is shaded by its percentage, so work out the percentage first and then find the class of the key it falls in. Classes such as '10 to less than 15' include 10 but not 15. Forgetting to multiply by 100 and then choosing the '0 to less than 5' class is the usual error.

Mark scheme
  1. 1 mark

    M1 for \(\dfrac{1158}{9650}\) (\(\times 100\)) oe

    oe, eg 0.12 seen, or \(\dfrac{9650 \times 10}{100} = 965\) and \(\dfrac{9650 \times 15}{100} = 1447.5\) compared with 1158.

  2. 1 mark

    A1 for 12(%) and the class 10 to less than 15

    Both the value (or a correct comparison such as 965 < 1158 < 1447.5) and the class are needed. Answer only (the class with no calculation) scores 0: the question says you must show your working. 0.12 with the class '10 to less than 15' scores M1A1.

Question 3

2 marks

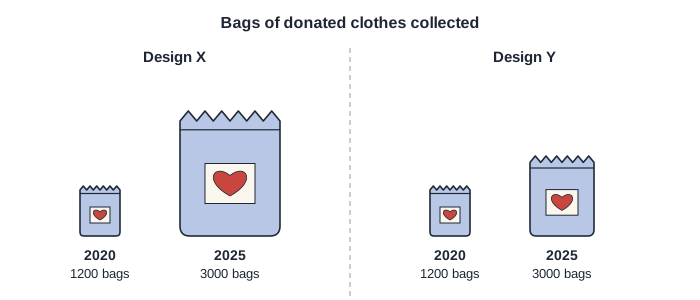
A charity shop collected 1200 bags of donated clothes in 2020 and 3000 bags in 2025. A designer drew two possible pictures for the shop's poster, Design X and Design Y, shown in the diagram.

In Design X, the 2025 bag is 2.5 times as tall and 2.5 times as wide as the 2020 bag.
In Design Y, the 2025 bag is 1.6 times as tall and 1.6 times as wide as the 2020 bag.

Which design gives a fairer impression of the increase in the number of bags collected? Give a reason for your answer.

Diagram titled 'Bags of donated clothes collected', in two halves separated by a dashed line: Design X on the left and Design Y on the right. Each design shows two pictures of a bag with a heart on a label, standing on the same line: a small bag labelled 2020, 1200 bags, and a larger bag labelled 2025, 3000 bags. The 2020 bag is the same size in both designs. In Design X the 2025 bag is 2.5 times as tall and 2.5 times as wide as the 2020 bag. In Design Y the 2025 bag is 1.6 times as tall and 1.6 times as wide as the 2020 bag.

Model answer

The number of bags increased by a factor of \(3000 \div 1200 = 2.5\).
People compare the areas of the pictures.
Design X: the area of the 2025 bag is \(2.5^2 = 6.25\) times the area of the 2020 bag, so the increase looks more than 6 times as big.
Design Y: the area of the 2025 bag is \(1.6^2 = 2.56\) times the area of the 2020 bag, which is close to 2.5.
Design Y gives the fairer impression.

Explanation

When a picture is enlarged in both directions by a scale factor k, its area is multiplied by \(k^2\), and readers judge a picture by its area. For a fair picture the area should increase by the same factor as the data, so each length should be multiplied by \(\sqrt{2.5} = 1.58\), which Design Y almost does. Scaling the lengths by the ratio of the data, as in Design X, exaggerates the increase.

Mark scheme
  1. 1 mark

    B1 for a correct area comparison for either design, eg the 2025 bag in Design X has \(2.5^2 = 6.25\) times the area of the 2020 bag, or the 2025 bag in Design Y has \(1.6^2 = 2.56\) times the area

    oe, eg 'in Design X the 2025 bag looks more than 6 times as big'. Also accept \(\sqrt{2.5} = 1.58\) linked to the scale factor for the sides. A statement that one bag looks bigger, with no reference to area or to both dimensions, scores B0.

  2. 1 mark

    B1 for Design Y, as the number of bags increased by a factor of 2.5 (3000 \(\div\) 1200) and the area of its 2025 bag is about 2.5 times (2.56 times) as big oe

    oe, eg 'Design Y, because Design X makes the increase look about 6 times as big when it was only 2.5 times'. 'Design Y' with no reason scores B0. 'Design X, because its bag is 2.5 times as tall and the number of bags went up 2.5 times' scores B0 B0. Ignore extraneous non-contradictory comments.

Question 4

4 marks

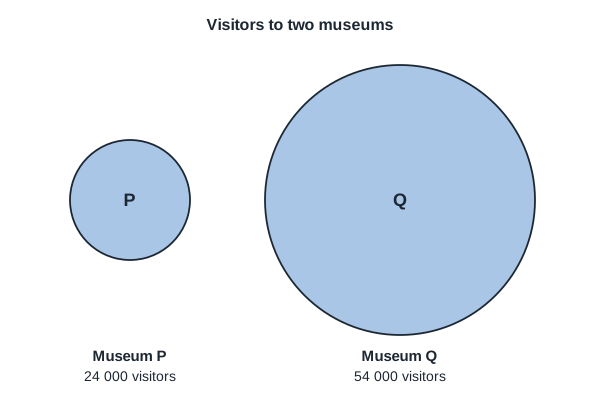
A tourist board's report shows the numbers of visitors to two museums, P and Q, as two circles. The designer made the radius of each circle proportional to the number of visitors.

Museum P had 24 000 visitors. Its circle has a radius of 2 cm.
Museum Q had 54 000 visitors. Its circle has a radius of 4.5 cm.

Explain why the diagram is misleading.

The areas of the circles should be proportional to the numbers of visitors. Work out the radius that the circle for Museum Q should have.

Two circles, titled 'Visitors to two museums', drawn to scale side by side. The smaller circle is labelled P, with 'Museum P, 24 000 visitors' underneath; its radius is 2 cm. The larger circle is labelled Q, with 'Museum Q, 54 000 visitors' underneath; its radius is 4.5 cm.

Model answer

Readers judge a circle by its area. Q's radius is \(\dfrac{4.5}{2} = 2.25\) times P's radius, so its area is \(2.25^2 = 5.0625\) times P's area. Q had only \(\dfrac{54\,000}{24\,000} = 2.25\) times as many visitors, so Q looks about five times as popular when it was only 2.25 times as popular.

For areas proportional to visitors:
\(\dfrac{r^2}{2^2} = \dfrac{54\,000}{24\,000} = 2.25\)
\(r = 2 \times \sqrt{2.25} = 2 \times 1.5 = 3\)

Radius = 3 cm

Explanation

When circles represent quantities, their areas must be in the same ratio as the quantities, so the radii are in the ratio of the square roots. Scaling the radius by the ratio itself multiplies the area by the square of that ratio and exaggerates the difference - the same distortion as in incorrectly drawn comparative pie charts.

Mark scheme
  1. 1 mark

    B1 for readers compare the areas (sizes) of the circles, and the areas are not proportional to the numbers of visitors oe

    oe, eg 'making the radius proportional exaggerates the difference', 'Museum Q's circle looks too big'.

  2. 1 mark

    B1 for the area of Q's circle is \(\left(\dfrac{4.5}{2}\right)^2 = 5.0625\) (about 5) times the area of P's circle, but Q had only 2.25 times as many visitors oe

    Both the area factor (5.06, or about 5) and the visitor factor (2.25) are needed, or an equivalent comparison, eg 'Q looks about 5 times as popular but was only 2.25 times as popular'.

  3. 1 mark

    M1 for \(2 \times \sqrt{\dfrac{54\,000}{24\,000}}\) oe

    oe, eg \(\dfrac{r^2}{2^2} = \dfrac{54\,000}{24\,000}\), \(r^2 = 9\), or \(\pi r^2 = 2.25 \times 4\pi\).

  4. 1 mark

    A1 for 3 (cm)

    cao. A correct radius with no working scores both marks for this part. 4.5 (the radius drawn) or 9 (\(r^2\)) scores M0A0 unless a correct method is seen.

Ready to try the rest? Every answer you write is marked against the mark scheme, so you can see exactly where the marks are.

Study Helper Hints first, answers after you try

Stuck on this one? Ask for a hint and I’ll point you in the right direction, without giving the answer away. Once you’ve checked your answer, I’ll show you how the marks are awarded.