
Level:
Correct: 0
Incorrect: 0
Marks: 0/0
Exam Practice
Course:
Topics:
Edexcel GCSE Statistics (Higher Paper 1) Smart practice A mixed round aimed at your weak spots
Unit 1
The statistical enquiry cycle
Statistical enquiry cycle stages 1 and 2; (a) Planning: 1a.01, 1a.02, 1a.03
Statistical enquiry cycle: planning and collecting
Statistical enquiry cycle stages 3, 4 and 5
Statistical enquiry cycle: interpreting and evaluating
Unit 2
The collection of data
(b) Types of data: 1b.01, 1b.02, 1b.03
Types of data and variables
(b) Types of data: 1b.04; (d) Collecting data: 1d.01, 1d.02
Primary and secondary data, reliability and validity
(c) Population and sampling: 1c.01, 1c.02, 1c.03
Populations, sampling frames and non-random sampling
(c) Population and sampling: 1c.04, 1c.05
Random and systematic sampling
(c) Population and sampling: 1c.06
Stratified sampling
(d) Collecting data: 1d.05, 1d.06
Problems with collected data and cleaning data
Unit 3
Processing, representing and analysing data
(a) Tabulation, diagrams and representation: 2a.01
Tabulation, tallies, pictograms and two-way tables
(a) Tabulation, diagrams and representation: 2a.01, 2a.02
Pie charts and comparative pie charts
(a) Tabulation, diagrams and representation: 2a.01
Stem and leaf diagrams
(a) Tabulation, diagrams and representation: 2a.02
Population pyramids, choropleth maps and 2D and 3D diagrams
(a) Tabulation, diagrams and representation: 2a.04
Histograms and frequency density
(a) Tabulation, diagrams and representation: 2a.05, 2a.06, 2a.07, 2a.08
Choosing representations and misleading diagrams
(a) Tabulation, diagrams and representation: 2a.09, 2a.10
Skewness
(b) Measures of central tendency: 2b.01, 2b.02, 2b.03
Mode, median and mean
(b) Measures of central tendency: 2b.01
Weighted mean and geometric mean
(c) Measures of dispersion: 2c.01, 2c.06
Standard deviation and standardised scores
(a) Tabulation, diagrams and representation: 2a.03; (c) Measures of dispersion: 2c.02, 2c.03
Box plots and outliers
(b) Measures of central tendency: 2b.03; (c) Measures of dispersion: 2c.04, 2c.05
Comparing distributions
(d) Further summary statistics: 2d.01
Index numbers
(d) Further summary statistics: 2d.02
Rates of change
(e) Scatter diagrams and correlation: 2e.01, 2e.02, 2e.03
Scatter diagrams, correlation and causation
(e) Scatter diagrams and correlation: 2e.04
Lines of best fit and regression lines
(e) Scatter diagrams and correlation: 2e.05, 2e.06, 2e.07, 2e.08
Spearman's rank and product moment correlation coefficients
(f) Time series: 2f.01, 2f.02; (b) 2b.01 mean seasonal variation
Time series, moving averages and seasonal variation
(g) Quality assurance: 2g.01, 2g.02
Quality assurance and control charts
(h) Estimation: 2h.01, 2h.02, 2h.03
Estimation, sample size and capture-recapture
Unit 4
Probability
3. Probability: 3p.01, 3p.02, 3p.03, 3p.04
Probability, expected frequency and risk
3. Probability: 3p.05, 3p.06, 3p.10
Experimental and theoretical probability and bias
3. Probability: 3p.11
Binomial distribution
3. Probability: 3p.12, 3p.13
Normal distribution
Avg
score:
–
Topics
done:
0/40

Pie charts and comparative pie charts

Practise 13 exam-style questions on Pie charts and comparative pie charts for Edexcel GCSE Statistics (Higher Paper 1). Write your answer as you would in the exam and get it marked in seconds against the mark scheme, point by point, with the Study Helper on hand if you get stuck.

  • 13 questions
  • 1–5 marks each
  • Instant marking
  • No sign-up needed
13 questions, marked as you go

Sample questions with model answers

Here are 4 of the questions in this topic, each with a model answer, an explanation of why it earns the marks and the mark scheme an examiner would use.

Question 1

1 mark

Two bookshops, Bookshop A and Bookshop B, recorded the type of each book they sold last week. The pie charts show the results.

Theo says, "The two bookshops sold the same number of crime books last week, because the crime sectors have the same angle."

Explain why Theo might be wrong.
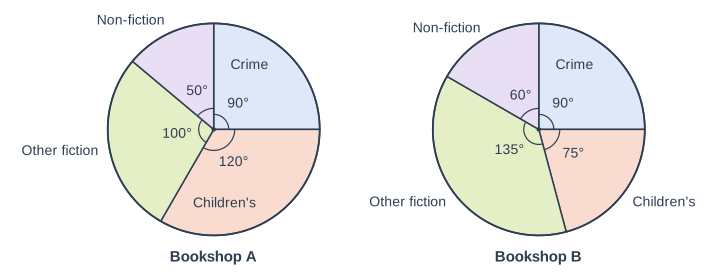
Two pie charts side by side, labelled "Bookshop A" (left) and "Bookshop B" (right). "Bookshop A": A circle divided into sectors, drawn clockwise from the top (12 o'clock): Crime, 90° (printed); Children's, 120° (printed); Other fiction, 100° (printed); Non-fiction, 50° (printed). Each printed angle is marked with a small arc at the centre. "Bookshop B": A circle divided into sectors, drawn clockwise from the top (12 o'clock): Crime, 90° (printed); Children's, 75° (printed); Other fiction, 135° (printed); Non-fiction, 60° (printed). Each printed angle is marked with a small arc at the centre.

Model answer

Each crime sector is 90°, so crime books were \(\dfrac{90}{360} = \dfrac{1}{4}\) of each bookshop's sales. But the pie charts do not show how many books each shop sold altogether. If Bookshop B sold more books than Bookshop A, a quarter of its sales is more books, so the numbers of crime books would not be the same.

Explanation

Equal angles in two ordinary pie charts mean equal proportions, not equal frequencies. To compare numbers you also need each chart's total; comparative pie charts, whose areas show the totals, would make this possible. Saying only that the pie charts look different does not answer the question.

Mark scheme
  1. 1 mark

    B1 for an explanation that the pie charts show the proportion of each shop's books, not the number, and the two shops may have sold different numbers of books altogether

    oe, eg 'the same angle only means the same fraction (a quarter) of each shop's sales', 'we do not know how many books each shop sold', 'if Bookshop B sold more books in total, it sold more crime books'. Allow an implication that the totals may be different, eg 'we do not know the totals'. B0 for 'the pie charts may not be accurate', 'there is no key', or 'Theo is right because the angles are equal'. Ignore extraneous non-contradictory comments.
Question 2

2 marks

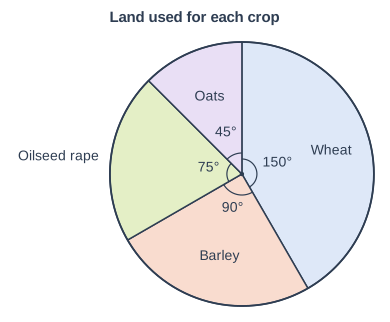
A farmer grows four crops. The pie chart shows how the land on her farm is shared between the crops.

She uses 54 hectares of land for barley.

Work out how much more land she uses for wheat than for oats.

Land used for each crop. Pie chart. A circle divided into sectors, drawn clockwise from the top (12 o'clock): Wheat, 150° (printed); Barley, 90° (printed); Oilseed rape, 75° (printed); Oats, 45° (printed). Each printed angle is marked with a small arc at the centre.

Model answer

90° represents 54 hectares, so 1° represents \(54 \div 90 = 0.6\) hectares.
Wheat: \(150 \times 0.6 = 90\) hectares
Oats: \(45 \times 0.6 = 27\) hectares
Difference \(= 90 - 27 = 63\)

Answer: 63 hectares

Explanation

Sector angles are proportional to the amounts they represent, so find the amount for 1° (or use the ratio of the angles, \(\dfrac{105}{90}\)) and scale it. A pie chart can show any quantity shared between categories, such as an area of land, not only numbers of people. Giving the difference in degrees, 105, rather than in hectares is a common slip.

Mark scheme
  1. 1 mark

    M1 for \(\dfrac{150 - 45}{90} \times 54\) oe

    oe, eg \(54 \div 90\) (= 0.6 hectares per degree) used with 150 or 45; wheat 90 (hectares) or oats 27 (hectares) seen; or the total land \(54 \times 4 = 216\) (hectares) followed by \(\dfrac{105}{360} \times 216\). 105 (the difference in degrees) on its own scores M0. Answer-only rule for this question: Correct answer with no working scores 2 marks.

  2. 1 mark

    A1 for 63 (hectares)

    cao. Correct answer with no working scores 2 marks. 90 (the land for wheat) or 27 (the land for oats) given as the answer scores M1A0. 216 (the total land) on its own, with no method for wheat or oats, scores M0A0.

Question 3

3 marks

A zoo asked visitors to choose their favourite animal, in 2014 and in 2024. The results are shown in comparative pie charts.

The pie chart for 2014 has a radius of 2.5 cm.
The pie chart for 2024 has a radius of 3.5 cm.
In 2024, 147 visitors chose the lions. The sector for the lions in the 2024 pie chart has an angle of 108°.

Work out the number of visitors who were asked in 2014.

Model answer

108° represents 147 visitors, so the 2024 pie chart represents \(\dfrac{147}{108} \times 360 = 490\) visitors.
The areas are proportional to the numbers of visitors:
\(\dfrac{N}{490} = \dfrac{2.5^2}{3.5^2} = \dfrac{6.25}{12.25}\)
\(N = 490 \times \dfrac{6.25}{12.25} = 250\)

Answer: 250 visitors

Explanation

First use the sector to find the total that the 2024 chart represents. Then use the fact that the area of each comparative pie chart, not its radius, is proportional to its total: the ratio of the totals is the square of the ratio of the radii. The 2014 chart is smaller, so it must represent fewer visitors, which checks the direction of the scaling.

Mark scheme
  1. 1 mark

    M1 for \(\dfrac{147}{108} \times 360\) (= 490) oe

    A method to find the number of visitors asked in 2024, eg 108° represents 147 visitors, so 1° represents 1.361... visitors. Answer-only rule for this question: Correct answer with no working scores 3 marks.

  2. 1 mark

    M1 for their 490 \(\times \left(\dfrac{2.5}{3.5}\right)^2\) oe

    oe, eg \(\dfrac{N}{490} = \dfrac{2.5^2}{3.5^2}\), their 490 \(\div\) 1.96, their 490 \(\times \dfrac{6.25}{12.25}\). ft their total for 2024, provided it came from the lions sector. Using the ratio of the radii without squaring (\(490 \times \dfrac{2.5}{3.5}\) = 350) or the ratio upside down (\(490 \times 1.96\) = 960.4) scores M0.

  3. 1 mark

    A1 for 250

    cao. Correct answer with no working scores 3 marks. 350 scores M1M0A0.

Question 4

4 marks

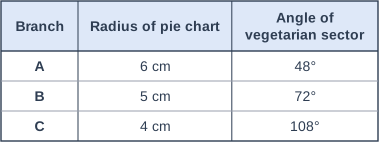
A sandwich shop has three branches, A, B and C. It drew comparative pie charts to show the types of sandwich that each branch sold last week.

The table gives the radius of each pie chart and the angle of its sector for vegetarian sandwiches.

Branch A sold 900 sandwiches last week.

Which branch sold the most vegetarian sandwiches last week?
You must show your working.

Table with columns "Branch", "Radius of pie chart", "Angle of vegetarian sector". Branch: A; Radius of pie chart: 6 cm; Angle of vegetarian sector: 48° | Branch: B; Radius of pie chart: 5 cm; Angle of vegetarian sector: 72° | Branch: C; Radius of pie chart: 4 cm; Angle of vegetarian sector: 108°.

Model answer

The areas of comparative pie charts are proportional to the totals.
Branch B: \(900 \times \left(\dfrac{5}{6}\right)^2 = 625\) sandwiches
Branch C: \(900 \times \left(\dfrac{4}{6}\right)^2 = 400\) sandwiches
Vegetarian sandwiches:
A: \(\dfrac{48}{360} \times 900 = 120\)
B: \(\dfrac{72}{360} \times 625 = 125\)
C: \(\dfrac{108}{360} \times 400 = 120\)
125 > 120, so Branch B sold the most vegetarian sandwiches.

Explanation

Branch C has the biggest angle and Branch A the biggest chart, but neither decides the number on its own: a sector's frequency depends on both its angle and its chart's total, and the total is proportional to the square of the radius. Working out each branch's total and then each vegetarian frequency (or comparing angle \(\times\) radius squared for the three sectors) shows that Branch B sold the most. Scaling the totals by the radii without squaring them is the usual error.

Mark scheme
  1. 1 mark

    M1 for a method to find the total number of sandwiches for Branch B or Branch C, eg \(900 \times \left(\dfrac{5}{6}\right)^2\) (= 625) or \(900 \times \left(\dfrac{4}{6}\right)^2\) (= 400) oe

    \(900 \times \dfrac{5}{6}\) (= 750) or \(900 \times \dfrac{4}{6}\) (= 600) scores M0. Alternative method (sector areas, without the totals): M1 for angle \(\times\) radius squared (or the sector area \(\dfrac{\theta}{360} \times \pi r^2\)) for one branch, eg \(48 \times 36\) (= 1728); then M1 for all three (1728, 1800 and 1728, or sector areas 15.1, 15.7 and 15.1 cm²), A1 for all three correct and B1 for Branch B.

  2. 1 mark

    M1 for a method to find the number of vegetarian sandwiches for at least two branches, eg \(\dfrac{48}{360} \times 900\) (= 120) and \(\dfrac{72}{360} \times\) their 625

    ft their totals for Branches B and C, provided they come from a method using the radii.

  3. 1 mark

    A1 for 120, 125 and 120

    For Branches A, B and C. Or 1728, 1800 and 1728 (or 15.1, 15.7 and 15.1 cm²) from the alternative method.

  4. 1 mark

    B1ft for Branch B, with a correct comparison of their values for all three branches

    Needs both M marks. Answer only scores 0: the question says you must show your working. 'Branch C, because it has the biggest angle' or 'Branch A, because it has the biggest pie chart' scores 0.

Ready to try the rest? Every answer you write is marked against the mark scheme, so you can see exactly where the marks are.

Study Helper Hints first, answers after you try

Stuck on this one? Ask for a hint and I’ll point you in the right direction, without giving the answer away. Once you’ve checked your answer, I’ll show you how the marks are awarded.