Level:
Correct: 0
Incorrect: 0
Marks: 0/0
Exam Practice
Course:
Topics:
Edexcel GCSE Statistics (Higher Paper 1) Smart practice A mixed round aimed at your weak spots
Unit 1
The statistical enquiry cycle
Statistical enquiry cycle stages 1 and 2; (a) Planning: 1a.01, 1a.02, 1a.03
Statistical enquiry cycle: planning and collecting
Statistical enquiry cycle stages 3, 4 and 5
Statistical enquiry cycle: interpreting and evaluating
Unit 2
The collection of data
(b) Types of data: 1b.01, 1b.02, 1b.03
Types of data and variables
(b) Types of data: 1b.04; (d) Collecting data: 1d.01, 1d.02
Primary and secondary data, reliability and validity
(c) Population and sampling: 1c.01, 1c.02, 1c.03
Populations, sampling frames and non-random sampling
(c) Population and sampling: 1c.04, 1c.05
Random and systematic sampling
(c) Population and sampling: 1c.06
Stratified sampling
(d) Collecting data: 1d.05, 1d.06
Problems with collected data and cleaning data
Unit 3
Processing, representing and analysing data
(a) Tabulation, diagrams and representation: 2a.01
Tabulation, tallies, pictograms and two-way tables
(a) Tabulation, diagrams and representation: 2a.01, 2a.02
Pie charts and comparative pie charts
(a) Tabulation, diagrams and representation: 2a.01
Stem and leaf diagrams
(a) Tabulation, diagrams and representation: 2a.02
Population pyramids, choropleth maps and 2D and 3D diagrams
(a) Tabulation, diagrams and representation: 2a.04
Histograms and frequency density
(a) Tabulation, diagrams and representation: 2a.05, 2a.06, 2a.07, 2a.08
Choosing representations and misleading diagrams
(a) Tabulation, diagrams and representation: 2a.09, 2a.10
Skewness
(b) Measures of central tendency: 2b.01, 2b.02, 2b.03
Mode, median and mean
(b) Measures of central tendency: 2b.01
Weighted mean and geometric mean
(c) Measures of dispersion: 2c.01, 2c.06
Standard deviation and standardised scores
(a) Tabulation, diagrams and representation: 2a.03; (c) Measures of dispersion: 2c.02, 2c.03
Box plots and outliers
(b) Measures of central tendency: 2b.03; (c) Measures of dispersion: 2c.04, 2c.05
Comparing distributions
(d) Further summary statistics: 2d.01
Index numbers
(d) Further summary statistics: 2d.02
Rates of change
(e) Scatter diagrams and correlation: 2e.01, 2e.02, 2e.03
Scatter diagrams, correlation and causation
(e) Scatter diagrams and correlation: 2e.04
Lines of best fit and regression lines
(e) Scatter diagrams and correlation: 2e.05, 2e.06, 2e.07, 2e.08
Spearman's rank and product moment correlation coefficients
(f) Time series: 2f.01, 2f.02; (b) 2b.01 mean seasonal variation
Time series, moving averages and seasonal variation
(g) Quality assurance: 2g.01, 2g.02
Quality assurance and control charts
(h) Estimation: 2h.01, 2h.02, 2h.03
Estimation, sample size and capture-recapture
Unit 4
Probability
3. Probability: 3p.01, 3p.02, 3p.03, 3p.04
Probability, expected frequency and risk
3. Probability: 3p.05, 3p.06, 3p.10
Experimental and theoretical probability and bias
3. Probability: 3p.11
Binomial distribution
3. Probability: 3p.12, 3p.13
Normal distribution
Avg
score:
–
Topics
done:
0/40

Mode, median and mean

Practise 17 exam-style questions on Mode, median and mean for Edexcel GCSE Statistics (Higher Paper 1). Write your answer as you would in the exam and get it marked in seconds against the mark scheme, point by point, with the Study Helper on hand if you get stuck.

  • 17 questions
  • 1–5 marks each
  • Instant marking
  • No sign-up needed
17 questions, marked as you go

Sample questions with model answers

Here are 4 of the questions in this topic, each with a model answer, an explanation of why it earns the marks and the mark scheme an examiner would use.

Question 1

1 mark

In a science lesson, Lily timed how long, in seconds, a toy car took to roll down a ramp. She did this 11 times.

2.4   2.5   2.5   2.6   2.6   2.7   2.7   2.8   2.8   2.9   6.3

Lily wants to use an average to describe the typical time.

Give a reason why the median is more appropriate than the mean for these data.

Model answer

One time, 6.3 seconds, is an extreme value: it is much longer than all the others, perhaps because the car hit the side of the ramp. It makes the mean (2.98 seconds) greater than 10 of the 11 times, but it does not affect the median (2.7 seconds).

Explanation

The mean uses every value, so a single extreme value pulls it towards itself; the median depends only on the middle of the ordered data. Use the median when there are outliers or the data are skewed. Saying the data are 'spread out' does not explain the choice: data can be widely spread with no extreme values.

Mark scheme
  1. 1 mark

    B1 for a reason that refers to the extreme value, eg the median is not affected by the extreme value / outlier of 6.3 / the mean is increased by the one much longer time of 6.3 seconds / the data are (positively) skewed

    Accept anomaly or outlier for extreme value. Accept 'the mean (2.98 seconds) is greater than 10 of the 11 times, so it is not typical' or 'the 6.3 is probably a mistake, and it would change the mean but not the median'. B0 for 'the data are spread out' (a common incorrect response), 'the median is the middle value' on its own, 'the median is more accurate / more reliable' with no reason, or 'the mean is not a whole number'. Ignore extraneous non-contradictory comments.
Question 2

2 marks

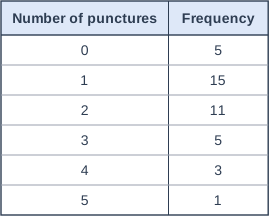
A cycling club asked 40 of its members how many punctures they had had on their bikes last year. The table shows the results.

Dev says, "The median number of punctures is 1, because more members had 1 puncture than any other number."

Is Dev correct?
You must show your working.

Table with columns "Number of punctures", "Frequency". Number of punctures: 0; Frequency: 5 | Number of punctures: 1; Frequency: 15 | Number of punctures: 2; Frequency: 11 | Number of punctures: 3; Frequency: 5 | Number of punctures: 4; Frequency: 3 | Number of punctures: 5; Frequency: 1.

Model answer

n = 40, so the median is the \(\dfrac{40 + 1}{2} = 20.5\)th value.
Cumulative frequencies: 5, 20, 31, 36, 39, 40
The 20th value is 1 and the 21st value is 2, so the median = \(\dfrac{1 + 2}{2} = 1.5\) punctures.

Dev is not correct: 1 is the mode (the most common number of punctures), not the median.

Explanation

The median is the middle value when all 40 members' numbers of punctures are put in order; the mode is the value with the highest frequency, which is what Dev found. Use cumulative frequencies to find the 20th and 21st values: here they are different, so the median, 1.5, is halfway between them.

Mark scheme
  1. 1 mark

    M1 for identifying the median as the 20.5th value, or as halfway between the 20th and 21st values

    eg cumulative frequencies 5, 20, 31 seen with 20.5, or 1 and 2 identified as the 20th and 21st values.

  2. 1 mark

    A1 for median = 1.5, so Dev is not correct

    Both the value 1.5 and the decision are needed. Accept 'No, 1 is the mode; the median is 1.5'. Answer only scores 0 (the question says you must show your working). 'No' with a median of 1 (the 20th value only) or 2 (the 21st value) scores M1A0 at most. 1.725 (the mean) scores M0A0.

Question 3

2 marks

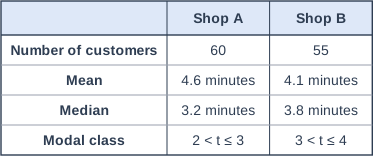
Ellie timed how long customers waited to be served at two coffee shops, Shop A and Shop B. She used statistical software to summarise the waiting times, t minutes. The table shows some of the output.

Ellie wants to use either the mean or the median to compare the typical waiting times at the two shops.

State which of these two averages she should use, giving a reason, and use it to compare the waiting times at the two shops.

Table with columns (row headings), "Shop A", "Shop B". Number of customers; Shop A: 60; Shop B: 55 | Mean; Shop A: 4.6 minutes; Shop B: 4.1 minutes | Median; Shop A: 3.2 minutes; Shop B: 3.8 minutes | Modal class; Shop A: 2 < t ≤ 3; Shop B: 3 < t ≤ 4.

Model answer

Ellie should use the median. At Shop A the mean (4.6 minutes) is much greater than the median (3.2 minutes), which shows that there are some very long waits (extreme values); these affect the mean but not the median.

The median waiting time at Shop B (3.8 minutes) is greater than the median waiting time at Shop A (3.2 minutes), so customers typically wait longer to be served at Shop B.

Explanation

When the mean is much larger than the median, a few large values are pulling the mean up, so the median gives a better idea of a typical value. Here the choice matters: the means suggest Shop A is slower, but the medians show that a typical customer waits longer at Shop B. Software output often lists several measures, and part of the skill is choosing the right one.

Mark scheme
  1. 1 mark

    B1 for median with a reason, eg the mean for Shop A is much greater than its median, so there are some extreme (very long) waiting times / the data are skewed, and the median is not affected by extreme values

    Accept 'median, because it is not affected by extreme values / outliers' or 'median, because the data are skewed'. B0 for median with no reason, or with a reason such as 'it is the middle value' or 'it is more accurate'. B0 for the mean (eg 'it uses all the data'): the mean is distorted by the long waits at Shop A.

  2. 1 mark

    B1 for a correct comparison of the medians in context, eg the median waiting time at Shop B (3.8 minutes) is greater than the median waiting time at Shop A (3.2 minutes), so customers typically wait longer at Shop B

    Independent of the first mark. Accept 'customers at Shop A typically wait less time than customers at Shop B'. Accept 'average' for median only if the values 3.8 and 3.2 are used. Must be in context (waiting times or waiting). B0 for stating the two medians without comparing them ('whereas' with the two values is not a comparison). A comparison of the means (which wrongly suggests Shop A is slower) or of the modal classes scores B0 for this mark.

Question 4

4 marks

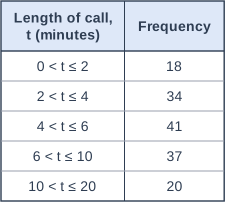
A call centre recorded the lengths, t minutes, of 150 calls one morning. The table gives information about these lengths.

The call centre has a target that the median length of calls should be less than 5 minutes.

Use linear interpolation to decide whether the call centre met its target that morning.
You must show your working.

Table with columns "Length of call, t (minutes)", "Frequency". Length of call, t (minutes): 0 < t ≤ 2; Frequency: 18 | Length of call, t (minutes): 2 < t ≤ 4; Frequency: 34 | Length of call, t (minutes): 4 < t ≤ 6; Frequency: 41 | Length of call, t (minutes): 6 < t ≤ 10; Frequency: 37 | Length of call, t (minutes): 10 < t ≤ 20; Frequency: 20.

Model answer

n = 150, so the median is the \(150 \div 2 = 75\)th value.
Cumulative frequencies: 18, 52, 93, 130, 150, so the median is in the class 4 < t ≤ 6.
Median = \(4 + \dfrac{75 - 52}{41} \times 2 = 4 + 1.12... = 5.12\) minutes

5.12 > 5, so the median length of the calls was more than 5 minutes. The call centre did not meet its target.

Explanation

The median class (4 to 6 minutes) contains 5 minutes, so naming the class cannot settle the question and interpolation is needed. The class width is 2 minutes, and 52 is the number of calls before the median class; using the wrong width or the wrong cumulative frequency are the common errors. Always finish by answering the question that was asked.

Mark scheme
  1. 1 mark

    M1 for identifying the class 4 < t ≤ 6 as the class containing the median

    eg the 75th (or 75.5th) value located in 4 < t ≤ 6, or cumulative frequencies 18, 52, 93 seen with this class indicated.

  2. 1 mark

    M1 for \(4 + \dfrac{75 - 52}{41} \times 2\) oe

    Accept 75.5 for 75: \(4 + \dfrac{75.5 - 52}{41} \times 2\). Also accept working down from the upper bound, eg \(6 - \dfrac{93 - 75}{41} \times 2\).

  3. 1 mark

    A1 for awrt 5.12, or awrt 5.15 if 75.5 is used

    Accept 5.1 from correct working. Accept 5.122 or 5.146 or better. Answer only scores 0 (the question says you must show your working).

  4. 1 mark

    B1 for the target was not met because the (estimated) median is greater than 5 minutes, eg 5.12 > 5

    Dependent on both M1 marks (not adjacent, so not marked dependent). ft their median from a correct method. B0 for a decision with no reference to a value of the median. The estimated mean (6.1 minutes) is not relevant and scores no marks.

Ready to try the rest? Every answer you write is marked against the mark scheme, so you can see exactly where the marks are.

Study Helper Hints first, answers after you try

Stuck on this one? Ask for a hint and I’ll point you in the right direction, without giving the answer away. Once you’ve checked your answer, I’ll show you how the marks are awarded.