
Level:
Correct: 0
Incorrect: 0
Marks: 0/0
Exam Practice
Course:
Topics:
Edexcel GCSE Statistics (Higher Paper 1) Smart practice A mixed round aimed at your weak spots
Unit 1
The statistical enquiry cycle
Statistical enquiry cycle stages 1 and 2; (a) Planning: 1a.01, 1a.02, 1a.03
Statistical enquiry cycle: planning and collecting
Statistical enquiry cycle stages 3, 4 and 5
Statistical enquiry cycle: interpreting and evaluating
Unit 2
The collection of data
(b) Types of data: 1b.01, 1b.02, 1b.03
Types of data and variables
(b) Types of data: 1b.04; (d) Collecting data: 1d.01, 1d.02
Primary and secondary data, reliability and validity
(c) Population and sampling: 1c.01, 1c.02, 1c.03
Populations, sampling frames and non-random sampling
(c) Population and sampling: 1c.04, 1c.05
Random and systematic sampling
(c) Population and sampling: 1c.06
Stratified sampling
(d) Collecting data: 1d.05, 1d.06
Problems with collected data and cleaning data
Unit 3
Processing, representing and analysing data
(a) Tabulation, diagrams and representation: 2a.01
Tabulation, tallies, pictograms and two-way tables
(a) Tabulation, diagrams and representation: 2a.01, 2a.02
Pie charts and comparative pie charts
(a) Tabulation, diagrams and representation: 2a.01
Stem and leaf diagrams
(a) Tabulation, diagrams and representation: 2a.02
Population pyramids, choropleth maps and 2D and 3D diagrams
(a) Tabulation, diagrams and representation: 2a.04
Histograms and frequency density
(a) Tabulation, diagrams and representation: 2a.05, 2a.06, 2a.07, 2a.08
Choosing representations and misleading diagrams
(a) Tabulation, diagrams and representation: 2a.09, 2a.10
Skewness
(b) Measures of central tendency: 2b.01, 2b.02, 2b.03
Mode, median and mean
(b) Measures of central tendency: 2b.01
Weighted mean and geometric mean
(c) Measures of dispersion: 2c.01, 2c.06
Standard deviation and standardised scores
(a) Tabulation, diagrams and representation: 2a.03; (c) Measures of dispersion: 2c.02, 2c.03
Box plots and outliers
(b) Measures of central tendency: 2b.03; (c) Measures of dispersion: 2c.04, 2c.05
Comparing distributions
(d) Further summary statistics: 2d.01
Index numbers
(d) Further summary statistics: 2d.02
Rates of change
(e) Scatter diagrams and correlation: 2e.01, 2e.02, 2e.03
Scatter diagrams, correlation and causation
(e) Scatter diagrams and correlation: 2e.04
Lines of best fit and regression lines
(e) Scatter diagrams and correlation: 2e.05, 2e.06, 2e.07, 2e.08
Spearman's rank and product moment correlation coefficients
(f) Time series: 2f.01, 2f.02; (b) 2b.01 mean seasonal variation
Time series, moving averages and seasonal variation
(g) Quality assurance: 2g.01, 2g.02
Quality assurance and control charts
(h) Estimation: 2h.01, 2h.02, 2h.03
Estimation, sample size and capture-recapture
Unit 4
Probability
3. Probability: 3p.01, 3p.02, 3p.03, 3p.04
Probability, expected frequency and risk
3. Probability: 3p.05, 3p.06, 3p.10
Experimental and theoretical probability and bias
3. Probability: 3p.11
Binomial distribution
3. Probability: 3p.12, 3p.13
Normal distribution
Avg
score:
–
Topics
done:
0/40

Stem and leaf diagrams

Practise 13 exam-style questions on Stem and leaf diagrams for Edexcel GCSE Statistics (Higher Paper 1). Write your answer as you would in the exam and get it marked in seconds against the mark scheme, point by point, with the Study Helper on hand if you get stuck.

  • 13 questions
  • 1–6 marks each
  • Instant marking
  • No sign-up needed
13 questions, marked as you go

Sample questions with model answers

Here are 4 of the questions in this topic, each with a model answer, an explanation of why it earns the marks and the mark scheme an examiner would use.

Question 1

1 mark

Owen has shown his data in a stem and leaf diagram, but he has not written the leaves in each row in order of size.

Give a reason why the leaves in a stem and leaf diagram should be in order.

Model answer

When the leaves are in order, the values are listed from smallest to largest, so you can count along to find key values such as the median and the quartiles, and see the smallest and largest values straight away.

Explanation

An ordered stem and leaf diagram is a sorted list of the data, which is exactly what is needed to find the median, quartiles and range by counting positions. An unordered diagram still shows the shape of the distribution, but the values would have to be sorted before any of these could be found.

Mark scheme
  1. 1 mark

    B1 for so that key values such as the median, the quartiles or the smallest and largest values can be found easily oe

    oe, eg 'so you can count to the middle value to find the median', 'so you can read off the quartiles', 'so the lowest and highest values are easy to see for the range'. B0 for 'it looks neater', 'it is easier to read' or 'it is the rule' with no statistical reason. Ignore extraneous non-contradictory comments.
Question 2

2 marks

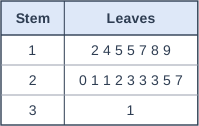
The stem and leaf diagram shows the masses, in kg, of 17 suitcases checked in at an airport desk.

Key: 1 | 2 means 12 kg

Write down the median mass.

Work out the range of the masses.

Table with columns "Stem", "Leaves". Stem: 1; Leaves: 2 4 5 5 7 8 9 | Stem: 2; Leaves: 0 1 1 2 3 3 3 5 7 | Stem: 3; Leaves: 1.

Model answer

There are 17 values, so the median is the \(\dfrac{17 + 1}{2} = 9\)th value.
The first row has 7 values, so the 9th value is the 2nd leaf on the stem 2: 21 kg.
Range \(= 31 - 12 = 19\) kg

Median: 21 kg; range: 19 kg

Explanation

Because the diagram is ordered, the median is found by counting to the middle position, \(\dfrac{n + 1}{2}\). The range is the largest value minus the smallest, which are the last leaf and the first leaf. Always turn the stem and leaf back into a value using the key.

Mark scheme
  1. 1 mark

    B1 for 21 (kg) (median)

    cao. The median is the 9th of the 17 values. B0 for 9 (the position, not the value), or for 2 | 1 written without its value.

  2. 1 mark

    B1 for 19 (kg) (range)

    cao. 31 - 12. B0 for '12 to 31' (not a single value) or 2 (the difference in stems). This mark is independent of the first.

Question 3

3 marks

Here are the heights, in cm, of 16 tomato plants.

34   52   47   29   61   38   45   53
41   36   58   44   27   49   33   55

Show these heights in an ordered stem and leaf diagram. Type each row of your diagram on a separate line, in the form stem | leaves, and include a key.

Model answer

2 | 7 9
3 | 3 4 6 8
4 | 1 4 5 7 9
5 | 2 3 5 8
6 | 1

Key: 2 | 7 means 27 cm

Explanation

Use the tens digit as the stem and the units digit as the leaf, include every stem from the smallest to the largest, then write the leaves in each row in order. Counting the leaves (16) checks that no height has been missed. A diagram always needs a key so that the reader knows what the stems and leaves stand for.

Mark scheme
  1. 2 marks

    B2 for a fully correct ordered stem and leaf diagram:
    2 | 7 9
    3 | 3 4 6 8
    4 | 1 4 5 7 9
    5 | 2 3 5 8
    6 | 1
    (B1 for an unordered diagram with all 16 values correct, or an ordered diagram with at most 2 errors)

    An error is a missing, extra or wrong leaf, or a leaf out of order. Stems of 20, 30, ... (eg 20 | 7 9) are condoned if the key makes the values clear. Leaves written as two digits (eg 2 | 27 29) score B0 for this point.

  2. 1 mark

    B1 for a correct key, eg 2 | 7 means 27 cm

    Any correct example from the stems used. Condone missing units in the key, but units must be correct if present. A key that does not match the diagram (eg 2 | 7 means 2.7 cm) scores B0. This mark is independent of the B2.

Question 4

4 marks

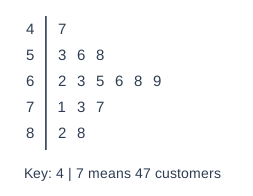
Jess runs a food truck. She moved the truck from an old site to a new site. The stem and leaf diagram shows the number of customers she served on each of 15 days at the new site.

At the old site, the median number of customers she served in a day was 60 and the interquartile range was 11.

Jess says, "On more than 75% of the days at the new site, I served more customers than my median at the old site."

Is Jess correct? You must show your working.

Compare the consistency of the numbers of customers she served at the two sites. You should show clearly the value of any statistics you use.

Stem and leaf diagram. Key: 4 | 7 means 47 customers. Rows (stem | leaves): 4 | 7; 5 | 3 6 8; 6 | 2 3 5 6 8 9; 7 | 1 3 7; 8 | 2 8.

Model answer

Days at the new site with more than 60 customers: 62, 63, 65, 66, 68, 69, 71, 73, 77, 82, 88, which is 11 days.
75% of 15 days = 11.25, so Jess would need at least 12 days. 11 < 11.25 (only \(\dfrac{11}{15} = 73.3\%\) of the days), so Jess is not correct.
(Also, the lower quartile is the 4th value, 58, which is less than 60.)

Lower quartile = 4th value = 58; upper quartile = 12th value = 73
Interquartile range \(= 73 - 58 = 15\) customers
15 > 11, so the numbers of customers she served at the new site were less consistent than at the old site.

Explanation

A statement that more than 75% of the values are above 60 is a statement about the lower quartile: it needs the lower quartile to be above 60. Count the days above 60 or find the lower quartile, then compare. For consistency compare the interquartile range with the old site's interquartile range; a larger interquartile range means the numbers of customers were less consistent.

Mark scheme
  1. 1 mark

    B1 for a correct statistic to test Jess's statement: 11 days (out of 15) with more than 60 customers, or 73.3% (\(\dfrac{11}{15}\)) of the days, or the lower quartile = 58

    The days with more than 60 customers: 62, 63, 65, 66, 68, 69, 71, 73, 77, 82, 88. The lower quartile is the 4th value (\(\dfrac{15 + 1}{4}\)); accept 57.5 from interpolating at the n/4 position. 75% of 15 days = 11.25 days, so at least 12 days would be needed.

  2. 1 mark

    B1ft for Jess is not correct, with a correct comparison, eg 11 < 11.25 (or 11 < 12), 73.3% < 75%, or 58 < 60

    ft their statistic, provided it is one of the kinds in the first mark point. Needs the decision and the comparison. 'No' with no supporting values scores 0 for this mark (the question says you must show your working).

  3. 1 mark

    B1 for interquartile range = 15

    73 - 58 (the 12th and 4th values). Accept 14 from interpolating at the n/4 positions (71.5 - 57.5). The range (41) cannot be compared with the old site's interquartile range: B0.

  4. 1 mark

    B1ft for a comparison of consistency in context, eg the numbers of customers at the new site were less consistent (more varied) than at the old site, as 15 > 11

    ft their interquartile range. Must be comparative, in context and use the interquartile ranges. 'The new site is more consistent because 15 > 11' scores B0.

Ready to try the rest? Every answer you write is marked against the mark scheme, so you can see exactly where the marks are.

Study Helper Hints first, answers after you try

Stuck on this one? Ask for a hint and I’ll point you in the right direction, without giving the answer away. Once you’ve checked your answer, I’ll show you how the marks are awarded.