Level:
Correct: 0
Incorrect: 0
Marks: 0/0
Exam Practice
Course:
Topics:
Edexcel GCSE Statistics (Higher Paper 1) Smart practice A mixed round aimed at your weak spots
Unit 1
The statistical enquiry cycle
Statistical enquiry cycle stages 1 and 2; (a) Planning: 1a.01, 1a.02, 1a.03
Statistical enquiry cycle: planning and collecting
Statistical enquiry cycle stages 3, 4 and 5
Statistical enquiry cycle: interpreting and evaluating
Unit 2
The collection of data
(b) Types of data: 1b.01, 1b.02, 1b.03
Types of data and variables
(b) Types of data: 1b.04; (d) Collecting data: 1d.01, 1d.02
Primary and secondary data, reliability and validity
(c) Population and sampling: 1c.01, 1c.02, 1c.03
Populations, sampling frames and non-random sampling
(c) Population and sampling: 1c.04, 1c.05
Random and systematic sampling
(c) Population and sampling: 1c.06
Stratified sampling
(d) Collecting data: 1d.05, 1d.06
Problems with collected data and cleaning data
Unit 3
Processing, representing and analysing data
(a) Tabulation, diagrams and representation: 2a.01
Tabulation, tallies, pictograms and two-way tables
(a) Tabulation, diagrams and representation: 2a.01, 2a.02
Pie charts and comparative pie charts
(a) Tabulation, diagrams and representation: 2a.01
Stem and leaf diagrams
(a) Tabulation, diagrams and representation: 2a.02
Population pyramids, choropleth maps and 2D and 3D diagrams
(a) Tabulation, diagrams and representation: 2a.04
Histograms and frequency density
(a) Tabulation, diagrams and representation: 2a.05, 2a.06, 2a.07, 2a.08
Choosing representations and misleading diagrams
(a) Tabulation, diagrams and representation: 2a.09, 2a.10
Skewness
(b) Measures of central tendency: 2b.01, 2b.02, 2b.03
Mode, median and mean
(b) Measures of central tendency: 2b.01
Weighted mean and geometric mean
(c) Measures of dispersion: 2c.01, 2c.06
Standard deviation and standardised scores
(a) Tabulation, diagrams and representation: 2a.03; (c) Measures of dispersion: 2c.02, 2c.03
Box plots and outliers
(b) Measures of central tendency: 2b.03; (c) Measures of dispersion: 2c.04, 2c.05
Comparing distributions
(d) Further summary statistics: 2d.01
Index numbers
(d) Further summary statistics: 2d.02
Rates of change
(e) Scatter diagrams and correlation: 2e.01, 2e.02, 2e.03
Scatter diagrams, correlation and causation
(e) Scatter diagrams and correlation: 2e.04
Lines of best fit and regression lines
(e) Scatter diagrams and correlation: 2e.05, 2e.06, 2e.07, 2e.08
Spearman's rank and product moment correlation coefficients
(f) Time series: 2f.01, 2f.02; (b) 2b.01 mean seasonal variation
Time series, moving averages and seasonal variation
(g) Quality assurance: 2g.01, 2g.02
Quality assurance and control charts
(h) Estimation: 2h.01, 2h.02, 2h.03
Estimation, sample size and capture-recapture
Unit 4
Probability
3. Probability: 3p.01, 3p.02, 3p.03, 3p.04
Probability, expected frequency and risk
3. Probability: 3p.05, 3p.06, 3p.10
Experimental and theoretical probability and bias
3. Probability: 3p.11
Binomial distribution
3. Probability: 3p.12, 3p.13
Normal distribution
Avg
score:
–
Topics
done:
0/40

Bar charts, line graphs and frequency polygons

Practise 14 exam-style questions on Bar charts, line graphs and frequency polygons for Edexcel GCSE Statistics (Higher Paper 1). Write your answer as you would in the exam and get it marked in seconds against the mark scheme, point by point, with the Study Helper on hand if you get stuck.

  • 14 questions
  • 1–5 marks each
  • Instant marking
  • No sign-up needed
14 questions, marked as you go

Sample questions with model answers

Here are 4 of the questions in this topic, each with a model answer, an explanation of why it earns the marks and the mark scheme an examiner would use.

Question 1

1 mark

Ninety students timed their walk to school one morning. The frequency polygon shows their times, t minutes, in the classes \(0 < t \le 5\), \(5 < t \le 10\), and so on up to \(30 < t \le 35\).

Write down the modal class.
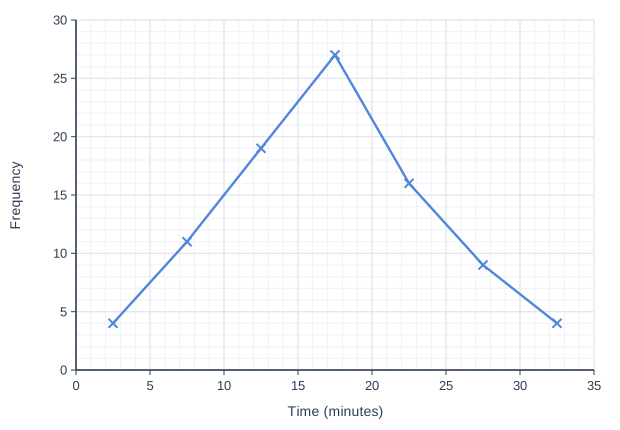
Line graph of frequency (y-axis, 0 to 30) against time (minutes) (x-axis, 0 to 35). The line joins the points (2.5, 4), (7.5, 11), (12.5, 19), (17.5, 27), (22.5, 16), (27.5, 9), (32.5, 4).

Model answer

The highest point of the frequency polygon is at (17.5, 27).
17.5 is the midpoint of the class from 15 to 20 minutes.
Modal class: \(15 < t \le 20\)

Explanation

The modal class is the class with the greatest frequency, which is the highest point of the polygon. The points are plotted at class midpoints, so the point at t = 17.5 stands for the class 15 to 20 minutes. Giving 17.5, or the frequency 27, is a common error: the answer is a class.

Mark scheme
  1. 1 mark

    B1 for \(15 < t \le 20\)

    Accept 15 to 20, 15-20, 15 < t < 20 or 15 ≤ t < 20, or 'between 15 and 20 minutes'. B0 for 17.5 alone (the midpoint), 27 (the greatest frequency) or a single time.
Question 2

2 marks

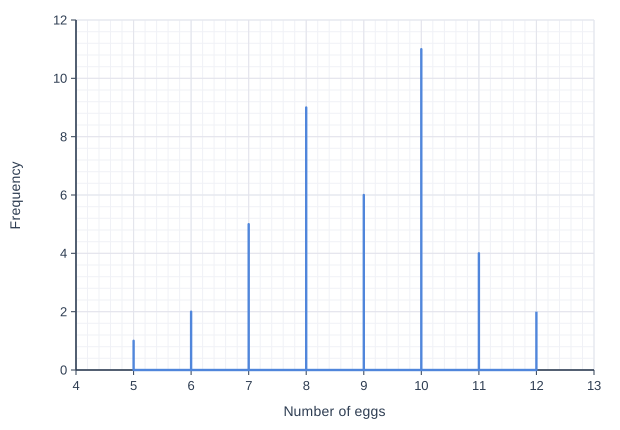
A wildlife group counted the number of eggs in each of 40 blue tit nests in a wood.
The bar line chart shows the results.

Find the median number of eggs in a nest.

Line graph of frequency (y-axis, 0 to 12) against number of eggs (x-axis, 4 to 13). The line joins the points (5, 0), (5, 1), (5, 0), (6, 0), (6, 2), (6, 0), (7, 0), (7, 5), (7, 0), (8, 0), (8, 9), (8, 0), (9, 0), (9, 6), (9, 0), (10, 0), (10, 11), (10, 0), (11, 0), (11, 4), (11, 0), (12, 0), (12, 2).

Model answer

n = 40, so the median is halfway between the 20th and 21st values.
Cumulative frequencies: 5 eggs 1, 6 eggs 3, 7 eggs 8, 8 eggs 17, 9 eggs 23.
The 18th to 23rd values are all 9, so the 20th and 21st values are both 9.
Median = 9 eggs

Explanation

Add up the frequencies from the lowest value until you pass the middle position, (40 + 1) ÷ 2 = 20.5. The median is a value of the variable (number of eggs), not a frequency. A common error is to give the mode (10, the tallest line) or the middle of the numbers along the axis.

Mark scheme
  1. 1 mark

    M1 for a method to find the 20th and 21st values (or the 20.5th value), e.g. cumulative frequencies 1, 3, 8, 17, 23 seen, or 20.5 or 20th and 21st seen

    Frequencies: 5 eggs 1, 6 eggs 2, 7 eggs 5, 8 eggs 9, 9 eggs 6, 10 eggs 11, 11 eggs 4, 12 eggs 2. Accept a list of the values in order with the middle identified. Answer-only rule for this question: A1 for 9 cao A correct answer with no working scores full marks.

  2. 1 mark

    A1 for 9 cao

    A correct answer with no working scores full marks. Common wrong answers: 10 (the mode), 8.5 (the middle of the numbers 5 to 12), 8.9 (the mean), or a frequency instead of a number of eggs.

Question 3

2 marks

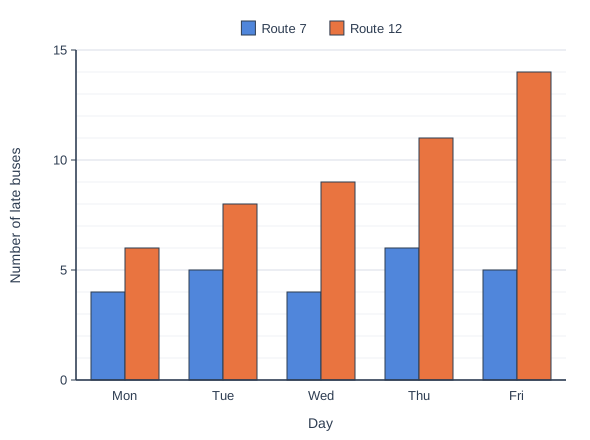
A bus company runs 40 buses each day on Route 7 and 40 buses each day on Route 12.
The dual bar chart shows the number of buses on each route that arrived late on each day of one week.

Give two comparisons between the numbers of late buses on the two routes.

Dual bar chart of number of late buses for each day, comparing Route 7 and Route 12 (a key above the chart shows which bar is which). Mon: Route 7 4, Route 12 6; Tue: Route 7 5, Route 12 8; Wed: Route 7 4, Route 12 9; Thu: Route 7 6, Route 12 11; Fri: Route 7 5, Route 12 14.

Model answer

1. Route 12 had more late buses than Route 7 on every day of the week: 48 in total, twice Route 7's 24.
2. The number of late buses on Route 12 increased through the week, from 6 on Monday to 14 on Friday, but on Route 7 it stayed about the same, between 4 and 6 each day.

Explanation

A comparison must say how the two routes differ, using comparative words such as 'more than' or 'increased, whereas'. Both routes run the same number of buses, so comparing the numbers of late buses directly is fair. Describing one route on its own, or comparing a single day, is not a comparison of the two routes.

Mark scheme
  1. 2 marks

    B2 for two different correct comparisons (B1 for one), e.g.
    - Route 12 had more late buses than Route 7 on every day / in total (48 compared with 24, twice as many)
    - the number of late buses on Route 12 increased during the week, but on Route 7 it stayed about the same (4 to 6)
    - the number of late buses varied more on Route 12 (from 6 to 14) than on Route 7 (from 4 to 6)
    - the difference between the two routes increased during the week (from 2 on Monday to 9 on Friday)

    1 mark for each different comparison, max 2. 'More late every day' and 'more late in total' count as the same comparison. Each comparison must refer to both routes: B0 for a statement about one route only (e.g. 'Route 12 increased') or for a comparison on one day only (e.g. 'on Friday Route 12 had more'). Ignore figures, but figures that are given must be correct. Ignore extraneous non-contradictory comments.

Question 4

4 marks

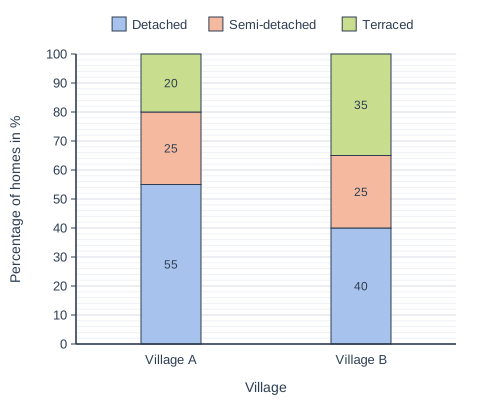
The percentage composite bar chart shows the type of each home in two villages, Village A and Village B. Each home is detached, semi-detached or terraced.

In Village A, 66 homes are detached.
Village B has 80 more homes than Village A.

Work out the percentage of all the homes in the two villages that are terraced.
Give your answer correct to 1 decimal place.

Stacked bar chart with 2 vertical bars. The value axis (y-axis) is "Percentage of homes in %", from 0 to 100 marked every 10; the bars are labelled along the x-axis, "Village", from left to right. Each bar is split into 3 parts, shown in the key: Detached (bottom, blue), Semi-detached (middle, orange) and Terraced (top, green). Values: Village A: detached 55%, semi-detached 25%, terraced 20%; Village B: detached 40%, semi-detached 25%, terraced 35%. The value of each part is printed on it.

Model answer

Village A: 55% of the homes = 66, so the total is \(66 \div 0.55 = 120\).
Village B: 120 + 80 = 200 homes.
Terraced in Village A: \(0.20 \times 120 = 24\)
Terraced in Village B: \(0.35 \times 200 = 70\)
Percentage that are terraced \(= \dfrac{24 + 70}{120 + 200} \times 100 = \dfrac{94}{320} \times 100 = 29.375\)
= 29.4% (1 dp)

Explanation

A percentage composite bar chart gives only percentages, so use the 66 detached homes (55%) to find Village A's total, then add 80 for Village B. Work out the number of terraced homes in each village and divide their total by all 320 homes. Averaging 20% and 35% to get 27.5% is a common error: it treats the two villages as if they were the same size.

Mark scheme
  1. 1 mark

    M1 for \(66 \div 0.55\) (= 120) oe, the number of homes in Village A

    Village A: detached 55%, semi-detached 25%, terraced 20%. Village B: detached 40%, semi-detached 25%, terraced 35%. Accept \(\dfrac{66}{55} \times 100\). \(\dfrac{66}{55} \times 20\) (= 24) for Village A's terraced homes scores this mark and the next. Answer-only rule for this question: A correct answer with no working scores full marks.

  2. 1 mark

    M1 for the number of terraced homes in one village: 20% of '120' (= 24) or 35% of ('120' + 80) (= 70)

    ft their 120. M0 for \(0.35 \times 80\) (= 28): 80 is the difference, not Village B's total.

  3. 1 mark

    M1 for ('24' + '70') \(\div\) ('120' + '200') \(\times 100\) oe

    Needs both numbers of terraced homes and both village totals from a correct method (ft their 120). 94/320 may be seen. The mean of the two percentages, (20 + 35) \(\div\) 2 = 27.5%, ignores the different village sizes: M0 for this mark and A0.

  4. 1 mark

    A1 for 29.4(%) (from 29.375)

    Accept awrt 29.4 or 29.375. A correct answer with no working scores full marks.

Ready to try the rest? Every answer you write is marked against the mark scheme, so you can see exactly where the marks are.

Study Helper Hints first, answers after you try

Stuck on this one? Ask for a hint and I’ll point you in the right direction, without giving the answer away. Once you’ve checked your answer, I’ll show you how the marks are awarded.