
Level:
Correct: 0
Incorrect: 0
Marks: 0/0
Exam Practice
Course:
Topics:
Edexcel GCSE Statistics (Higher Paper 1) Smart practice A mixed round aimed at your weak spots
Unit 1
The statistical enquiry cycle
Statistical enquiry cycle stages 1 and 2; (a) Planning: 1a.01, 1a.02, 1a.03
Statistical enquiry cycle: planning and collecting
Statistical enquiry cycle stages 3, 4 and 5
Statistical enquiry cycle: interpreting and evaluating
Unit 2
The collection of data
(b) Types of data: 1b.01, 1b.02, 1b.03
Types of data and variables
(b) Types of data: 1b.04; (d) Collecting data: 1d.01, 1d.02
Primary and secondary data, reliability and validity
(c) Population and sampling: 1c.01, 1c.02, 1c.03
Populations, sampling frames and non-random sampling
(c) Population and sampling: 1c.04, 1c.05
Random and systematic sampling
(c) Population and sampling: 1c.06
Stratified sampling
(d) Collecting data: 1d.05, 1d.06
Problems with collected data and cleaning data
Unit 3
Processing, representing and analysing data
(a) Tabulation, diagrams and representation: 2a.01
Tabulation, tallies, pictograms and two-way tables
(a) Tabulation, diagrams and representation: 2a.01, 2a.02
Pie charts and comparative pie charts
(a) Tabulation, diagrams and representation: 2a.01
Stem and leaf diagrams
(a) Tabulation, diagrams and representation: 2a.02
Population pyramids, choropleth maps and 2D and 3D diagrams
(a) Tabulation, diagrams and representation: 2a.04
Histograms and frequency density
(a) Tabulation, diagrams and representation: 2a.05, 2a.06, 2a.07, 2a.08
Choosing representations and misleading diagrams
(a) Tabulation, diagrams and representation: 2a.09, 2a.10
Skewness
(b) Measures of central tendency: 2b.01, 2b.02, 2b.03
Mode, median and mean
(b) Measures of central tendency: 2b.01
Weighted mean and geometric mean
(c) Measures of dispersion: 2c.01, 2c.06
Standard deviation and standardised scores
(a) Tabulation, diagrams and representation: 2a.03; (c) Measures of dispersion: 2c.02, 2c.03
Box plots and outliers
(b) Measures of central tendency: 2b.03; (c) Measures of dispersion: 2c.04, 2c.05
Comparing distributions
(d) Further summary statistics: 2d.01
Index numbers
(d) Further summary statistics: 2d.02
Rates of change
(e) Scatter diagrams and correlation: 2e.01, 2e.02, 2e.03
Scatter diagrams, correlation and causation
(e) Scatter diagrams and correlation: 2e.04
Lines of best fit and regression lines
(e) Scatter diagrams and correlation: 2e.05, 2e.06, 2e.07, 2e.08
Spearman's rank and product moment correlation coefficients
(f) Time series: 2f.01, 2f.02; (b) 2b.01 mean seasonal variation
Time series, moving averages and seasonal variation
(g) Quality assurance: 2g.01, 2g.02
Quality assurance and control charts
(h) Estimation: 2h.01, 2h.02, 2h.03
Estimation, sample size and capture-recapture
Unit 4
Probability
3. Probability: 3p.01, 3p.02, 3p.03, 3p.04
Probability, expected frequency and risk
3. Probability: 3p.05, 3p.06, 3p.10
Experimental and theoretical probability and bias
3. Probability: 3p.11
Binomial distribution
3. Probability: 3p.12, 3p.13
Normal distribution
Avg
score:
–
Topics
done:
0/40

Problems with collected data and cleaning data

Practise 13 exam-style questions on Problems with collected data and cleaning data for Edexcel GCSE Statistics (Higher Paper 1). Write your answer as you would in the exam and get it marked in seconds against the mark scheme, point by point, with the Study Helper on hand if you get stuck.

  • 13 questions
  • 1–5 marks each
  • Instant marking
  • No sign-up needed
13 questions, marked as you go

Sample questions with model answers

Here are 4 of the questions in this topic, each with a model answer, an explanation of why it earns the marks and the mark scheme an examiner would use.

Question 1

1 mark

A school records the number of days each student in Year 9 was absent during the autumn term. There were 70 school days in the autumn term.

One record shows that a student was absent for 84 days.

Explain why this value must be wrong.

Model answer

The term had only 70 school days, so a student cannot have been absent for 84 days. The value is impossible, so it must be an error.

Explanation

Some values can be shown to be wrong because they are impossible in context: here the number of days absent cannot be more than the number of school days. That is a stronger reason than saying it is an outlier, since outliers can be genuine. The record should be checked and corrected, or removed if it cannot be corrected.

Mark scheme
  1. 1 mark

    B1 for 84 is more than the 70 school days in the term, so a student cannot have been absent for 84 days / it is impossible

    oe. Must refer to the 70 days (or the length of the term). B0 for 'it is an outlier' or 'it is an anomaly' on its own. B0 for 'it is too big' with no reference to 70.
Question 2

2 marks

A college emailed a questionnaire about its careers advice to all 900 students who left the college last summer. Only 130 of them replied.

Explain why the non-response could make the college's results biased.
Suggest one way the college could deal with the non-response before it analyses the results.

Model answer

The 130 students who replied may not be typical of all 900 leavers. For example, students who are doing well in a job or a university course, or who have a strong complaint about the advice, may be more likely to reply, so the results could make the careers advice look better or worse than it really is.
The college could choose a random sample of the students who did not reply and telephone them to ask the questions, so that the views of the non-responders are included.

Explanation

Non-response matters because the people who reply are often not typical of the whole group, which biases the results; the number of replies on its own is not the main problem. Ways of dealing with it include reminders, incentives, another way of replying and following up a random sample of the non-responders. A pilot survey checks the questions; it does not deal with non-response.

Mark scheme
  1. 1 mark

    B1 for explaining that the students who replied may be different from those who did not, e.g. students who are happy with their job or course (or who have a strong complaint about the advice) are more likely to reply, so the results may not represent all 900 leavers

    oe. Must say how or why those who replied may differ from those who did not. B0 for 'only 130 replied' or 'the sample is too small' on its own (130 replies would be enough if they were typical). B0 for 'people may lie'.

  2. 1 mark

    B1 for a suitable way, e.g. send reminders (emails, text messages or letters) to those who have not replied / contact a random sample of the students who did not reply by telephone and ask them the questions / offer an incentive, such as a prize draw, for replying / send a paper copy with a prepaid envelope to those who have not replied

    oe. B0 for 'do a pilot survey', 'send it to more students' (every leaver was asked), 'replace the non-responders with other students' or 'ignore the non-responders' (these do not deal with the bias).

Question 3

3 marks

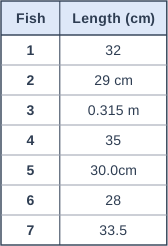
Jamal measures the lengths of seven fish. He types the lengths into a spreadsheet column headed 'Length (cm)'. The table shows what he typed.

The spreadsheet gives the median length as 32.75 cm.

Explain why this value is wrong.
Work out the correct median length of the seven fish.

Table with columns "Fish", "Length (cm)". Fish: 1; Length (cm): 32 | Fish: 2; Length (cm): 29 cm | Fish: 3; Length (cm): 0.315 m | Fish: 4; Length (cm): 35 | Fish: 5; Length (cm): 30.0cm | Fish: 6; Length (cm): 28 | Fish: 7; Length (cm): 33.5.

Model answer

The entries '29 cm', '0.315 m' and '30.0cm' have units typed in, so the spreadsheet reads them as text and leaves them out. 32.75 cm is the median of only the four plain numbers 28, 32, 33.5 and 35. Also, 0.315 m is in metres, not centimetres.

Cleaned lengths in cm: 32, 29, 31.5, 35, 30, 28, 33.5
In order: 28, 29, 30, 31.5, 32, 33.5, 35
The median is the 4th value: 31.5 cm

Explanation

Spreadsheet functions leave out entries that have units or symbols typed in, so the result uses only some of the data. Cleaning means removing extraneous units and symbols and converting every value to the same unit, here centimetres (0.315 m = 31.5 cm). If 0.315 is left as it is, it becomes the smallest value and the median comes out as 30 cm, which is wrong.

Mark scheme
  1. 1 mark

    B1 for some entries include units / text ('29 cm', '0.315 m', '30.0cm'), so the spreadsheet does not read them as numbers and leaves them out: 32.75 is the median of only the four plain numbers 28, 32, 33.5 and 35 / the lengths are not all in the same format or unit (0.315 m is in metres, not centimetres)

    oe. Accept 'there are extraneous symbols / units in some cells, so they are not used'. A reference to the units or text in the cells is enough for this mark; the working out of 32.75 is not needed. B0 for 'there is an outlier' or 'he has measured wrongly'. Answer-only rule for this question: A correct answer with no working scores full marks for this calculation (the B1 is for the explanation).

  2. 1 mark

    M1 for the cleaned lengths, with 0.315 m written as 31.5 cm, in order: 28, 29, 30, 31.5, 32, 33.5, 35

    Allow one error in copying the other values if 31.5 is used. M0 if 0.315 is used as 0.315 cm or left out.

  3. 1 mark

    A1 for 31.5 (cm)

    cao. A correct answer with no working scores full marks for this calculation (the B1 is for the explanation). 30 (using 0.315 as a length in cm) scores M0A0. 31 (the median of the six lengths without 0.315 m) scores M0A0. 32.75 scores M0A0.

Question 4

4 marks

Tom records the distance, in km, that each of the 40 employees at a company travels to work each day. He uses statistical software to summarise the data.

Lower quartile = 4.2 km   Median = 7.5 km   Upper quartile = 11.8 km

The five largest distances recorded are

18.4   21.9   26.5   31.0   1480

Before processing the data further, Tom wants to check for outliers.

Showing your calculation, identify any outliers. Explain how Tom should deal with each of them.

Model answer

IQR \(= 11.8 - 4.2 = 7.6\)
Upper limit \(= 11.8 + 1.5 \times 7.6 = 11.8 + 11.4 = 23.2\) km
(The lower limit is below 0, so there are no low outliers.)
The outliers are 26.5, 31.0 and 1480.

26.5 km and 31.0 km are long journeys, but people do travel that far to work, so these are probably genuine and Tom should keep them.
1480 km is impossible for a daily journey to work, so it is an error, probably 14.80 typed without the decimal point. Tom should check the original record and correct it, or remove it.

Explanation

An outlier is a value more than 1.5 times the IQR beyond a quartile. Finding outliers is only the first step of cleaning: each one must be judged in context. Genuine outliers are kept, and errors are corrected or removed. A common error is to remove every outlier without asking whether it could be real.

Mark scheme
  1. 1 mark

    M1 for \(11.8 + 1.5 \times (11.8 - 4.2)\) oe

    oe, e.g. \(1.5 \times 7.6 = 11.4\) seen. The lower limit \(4.2 - 11.4\) is below 0, so there are no low outliers; it need not be worked out.

  2. 1 mark

    A1 for 23.2

    cao. Implied by identifying 26.5, 31.0 and 1480 (and not 18.4 or 21.9) as the outliers with the M1 method seen.

  3. 1 mark

    B1 for 26.5 and 31.0 are outliers, but they are possible distances to travel to work, so they are probably genuine and should be kept

    oe. Both values must be identified as outliers and the decision to keep them must have a reason. Accept 'check them, and keep them if they are correct'. This mark is independent of the method marks.

  4. 1 mark

    B1 for 1480 is an outlier that is impossible for a daily journey to work, so it is an error (e.g. 14.80 typed without the decimal point): Tom should check it and correct it, or remove it

    oe. Must say that 1480 is an error / impossible / not genuine. This mark is independent of the method marks. B0 for 'remove all three outliers'.

Ready to try the rest? Every answer you write is marked against the mark scheme, so you can see exactly where the marks are.

Study Helper Hints first, answers after you try

Stuck on this one? Ask for a hint and I’ll point you in the right direction, without giving the answer away. Once you’ve checked your answer, I’ll show you how the marks are awarded.