
Level:
Correct: 0
Incorrect: 0
Marks: 0/0
Exam Practice
Course:
Topics:
Edexcel GCSE Statistics (Higher Paper 1) Smart practice A mixed round aimed at your weak spots
Unit 1
The statistical enquiry cycle
Statistical enquiry cycle stages 1 and 2; (a) Planning: 1a.01, 1a.02, 1a.03
Statistical enquiry cycle: planning and collecting
Statistical enquiry cycle stages 3, 4 and 5
Statistical enquiry cycle: interpreting and evaluating
Unit 2
The collection of data
(b) Types of data: 1b.01, 1b.02, 1b.03
Types of data and variables
(b) Types of data: 1b.04; (d) Collecting data: 1d.01, 1d.02
Primary and secondary data, reliability and validity
(c) Population and sampling: 1c.01, 1c.02, 1c.03
Populations, sampling frames and non-random sampling
(c) Population and sampling: 1c.04, 1c.05
Random and systematic sampling
(c) Population and sampling: 1c.06
Stratified sampling
(d) Collecting data: 1d.05, 1d.06
Problems with collected data and cleaning data
Unit 3
Processing, representing and analysing data
(a) Tabulation, diagrams and representation: 2a.01
Tabulation, tallies, pictograms and two-way tables
(a) Tabulation, diagrams and representation: 2a.01, 2a.02
Pie charts and comparative pie charts
(a) Tabulation, diagrams and representation: 2a.01
Stem and leaf diagrams
(a) Tabulation, diagrams and representation: 2a.02
Population pyramids, choropleth maps and 2D and 3D diagrams
(a) Tabulation, diagrams and representation: 2a.04
Histograms and frequency density
(a) Tabulation, diagrams and representation: 2a.05, 2a.06, 2a.07, 2a.08
Choosing representations and misleading diagrams
(a) Tabulation, diagrams and representation: 2a.09, 2a.10
Skewness
(b) Measures of central tendency: 2b.01, 2b.02, 2b.03
Mode, median and mean
(b) Measures of central tendency: 2b.01
Weighted mean and geometric mean
(c) Measures of dispersion: 2c.01, 2c.06
Standard deviation and standardised scores
(a) Tabulation, diagrams and representation: 2a.03; (c) Measures of dispersion: 2c.02, 2c.03
Box plots and outliers
(b) Measures of central tendency: 2b.03; (c) Measures of dispersion: 2c.04, 2c.05
Comparing distributions
(d) Further summary statistics: 2d.01
Index numbers
(d) Further summary statistics: 2d.02
Rates of change
(e) Scatter diagrams and correlation: 2e.01, 2e.02, 2e.03
Scatter diagrams, correlation and causation
(e) Scatter diagrams and correlation: 2e.04
Lines of best fit and regression lines
(e) Scatter diagrams and correlation: 2e.05, 2e.06, 2e.07, 2e.08
Spearman's rank and product moment correlation coefficients
(f) Time series: 2f.01, 2f.02; (b) 2b.01 mean seasonal variation
Time series, moving averages and seasonal variation
(g) Quality assurance: 2g.01, 2g.02
Quality assurance and control charts
(h) Estimation: 2h.01, 2h.02, 2h.03
Estimation, sample size and capture-recapture
Unit 4
Probability
3. Probability: 3p.01, 3p.02, 3p.03, 3p.04
Probability, expected frequency and risk
3. Probability: 3p.05, 3p.06, 3p.10
Experimental and theoretical probability and bias
3. Probability: 3p.11
Binomial distribution
3. Probability: 3p.12, 3p.13
Normal distribution
Avg
score:
–
Topics
done:
0/40

Skewness

Practise 16 exam-style questions on Skewness for Edexcel GCSE Statistics (Higher Paper 1). Write your answer as you would in the exam and get it marked in seconds against the mark scheme, point by point, with the Study Helper on hand if you get stuck.

  • 16 questions
  • 1–5 marks each
  • Instant marking
  • No sign-up needed
16 questions, marked as you go

Sample questions with model answers

Here are 4 of the questions in this topic, each with a model answer, an explanation of why it earns the marks and the mark scheme an examiner would use.

Question 1

1 mark

The skew of the waiting times at a doctor's clinic is 0.8

Which one of these statements gives a correct interpretation of this skew?

A   More than half of the waiting times are longer than the mean waiting time.
B   The waiting times longer than the median are more spread out than the waiting times shorter than the median.
C   Most of the waiting times are long.
D   The mean waiting time is less than the median waiting time.

Choose your answer.

  • A
  • B
  • C
  • D

Model answer

B
The skew is positive, so the waiting times above the median are more spread out than the waiting times below the median.

Explanation

Positive skew means a long tail of high values: most waiting times are fairly short and a few are much longer. So the values above the median are more spread out, and the mean is pulled above the median, which means fewer than half of the times are longer than the mean.

Mark scheme
  1. 1 mark

    B1 for B

    A is wrong: with positive skew the mean is greater than the median, so fewer than half of the times are longer than the mean. C is wrong: positive skew means most times are short, with a tail of a few long times. D is wrong: positive skew means the mean is greater than the median. More than one answer scores B0.
Question 2

2 marks

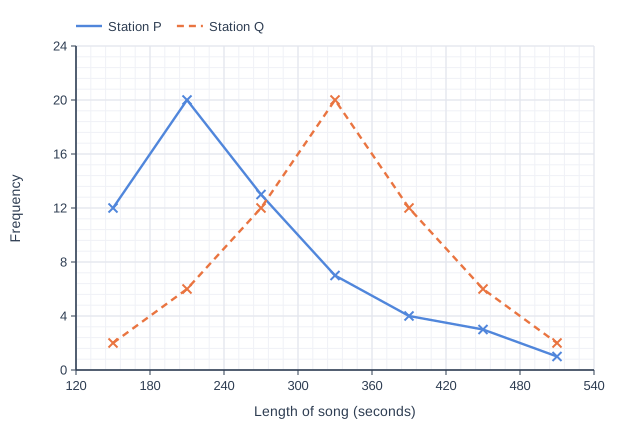
A music student recorded the lengths of 60 songs played on radio Station P and 60 songs played on radio Station Q. She grouped the lengths into classes of width 60 seconds, from 120 seconds to 540 seconds.
The frequency polygons show her results.

Compare the skew of the two distributions.
Interpret your comparison in context.

Line graph of frequency (y-axis, 0 to 24) against length of song (seconds) (x-axis, 120 to 540). "Station P" joins the points (150, 12), (210, 20), (270, 13), (330, 7), (390, 4), (450, 3), (510, 1). "Station Q" (dashed) joins the points (150, 2), (210, 6), (270, 12), (330, 20), (390, 12), (450, 6), (510, 2).

Model answer

The Station P lengths have positive skew, and the Station Q lengths are symmetrical.
Most of the songs on Station P are fairly short (the peak is at 180 to 240 seconds), with a tail of a few much longer songs. The lengths of the Station Q songs are spread evenly either side of the middle class, 300 to 360 seconds, with as many short songs as long ones.

Explanation

Judge skew from the shape of each polygon: a peak on the left with a long tail to the right is positive skew, and a polygon that is the same on both sides of its peak is symmetrical. The interpretation should describe how the lengths are spread, not which station plays longer songs, which is a comparison of averages.

Mark scheme
  1. 1 mark

    B1 for the Station P lengths have positive skew and the Station Q lengths are (approximately) symmetrical

    Both needed. Accept 'the Station P lengths are more (positively) skewed than the Station Q lengths' or 'no skew' for symmetrical. Do not accept 'symmetrical skew', 'normal skew', 'normally distributed' or 'positive correlation'.

  2. 1 mark

    B1 for a correct interpretation in context, e.g. most songs on Station P are fairly short, with a few much longer songs, whereas the lengths of the Station Q songs are spread evenly either side of the middle (about 330 seconds)

    oe. Dependent on the first B1. Accept 'for Station P the lengths above the median are more spread out than the lengths below it, but for Station Q the lengths are equally spread either side of the median'. Must refer to songs or their lengths. A comparison of which station plays longer songs on average does not earn this mark. Reference to more songs above (or below) the median scores B0.

Question 3

3 marks

A survey recorded the age, \(x\) years, of each of the 25 cars parked in a supermarket car park one morning. The survey found
\(\sum x = 205\)   \(\sum x^2 = 2105\)
The median age of the cars was 7 years.

standard deviation \(= \sqrt{\dfrac{\sum x^2}{n} - \left(\dfrac{\sum x}{n}\right)^2}\)
skew \(= \dfrac{3(\text{mean} - \text{median})}{\text{standard deviation}}\)

Work out the skew of the ages of the cars, correct to 2 decimal places.

Model answer

mean \(= 205 \div 25 = 8.2\) years
standard deviation \(= \sqrt{\dfrac{2105}{25} - 8.2^2} = \sqrt{84.2 - 67.24} = \sqrt{16.96} = 4.118...\) years
skew \(= \dfrac{3(8.2 - 7)}{4.118...} = \dfrac{3.6}{4.118...} = 0.87\)

Explanation

Find the mean first (205 ÷ 25), then use it in the standard deviation formula, and only then work out the skew. Keep the unrounded standard deviation in your calculator: rounding it to 4.1 changes the second decimal place of the skew. The formula divides by n = 25, not by 24.

Mark scheme
  1. 1 mark

    M1 for \(\sqrt{\dfrac{2105}{25} - \left(\dfrac{205}{25}\right)^2}\) (= 4.118...)

    Accept [4.11, 4.12] for the standard deviation. Mean = 8.2 may be seen. Using the \(n - 1\) divisor gives a standard deviation of 4.203 and a skew of 0.86: this scores the M marks only (M1M1A0). Answer-only rule for this question: A correct answer with no working scores full marks.

  2. 1 mark

    M1 for \(\dfrac{3(8.2 - 7)}{\text{their standard deviation}}\)

    ft their mean and standard deviation; the standard deviation must be a numerical value, not just the words 'standard deviation'.

  3. 1 mark

    A1 for 0.87

    awrt 0.87 (0.8741...). Using a standard deviation rounded to 4.12 gives 0.87 (A1); rounded to 4.1 it gives 0.88 (A0). A correct answer with no working scores full marks.

Question 4

4 marks

A hospital recorded the times, in minutes, that patients spent in its accident and emergency department in one week.
mean = 186 minutes   median = 164 minutes   standard deviation = 61 minutes

A local newspaper says,
"More than half of the patients spent longer than the mean time in the department."

skew \(= \dfrac{3(\text{mean} - \text{median})}{\text{standard deviation}}\)

Calculate the skew of the times, correct to 2 decimal places, and use it to assess the newspaper's statement.
You must show your working.

Model answer

skew \(= \dfrac{3(186 - 164)}{61} = \dfrac{66}{61} = 1.08\)
The skew is positive, so the mean (186 minutes) is greater than the median (164 minutes).
Half of the patients spent 164 minutes or less, which is less than the mean. So at least half of the patients spent less than the mean time, and fewer than half spent longer than the mean. The newspaper's statement is wrong.

Explanation

With positive skew a few very long times pull the mean above the median. Because half the values are at or below the median, at least half are below the mean. A statement about 'more than half' must be checked against the median, the value that splits the data in half.

Mark scheme
  1. 1 mark

    M1 for \(\dfrac{3(186 - 164)}{61}\)

    Correct substitution of the mean, median and standard deviation into the formula.

  2. 1 mark

    A1 for 1.08

    awrt 1.08 (1.0819...). 1.1 scores A0 unless 1.08 (or 1.081...) is seen in the working, as 2 decimal places were asked for. Answer only scores M0A0, as the question asks for working.

  3. 1 mark

    B1 for the skew is positive, so the mean is greater than the median (186 > 164)

    oe. ft a positive value of their skew.

  4. 1 mark

    B1 for the statement is wrong, because half of the patients spent 164 minutes (the median) or less, which is less than the mean, so fewer than half spent longer than the mean

    oe. Dependent on the previous B1. Accept 'at most half' or 'not more than half' for 'fewer than half'. 'The statement is wrong because the skew is positive' with no further reason scores B0.

Ready to try the rest? Every answer you write is marked against the mark scheme, so you can see exactly where the marks are.

Study Helper Hints first, answers after you try

Stuck on this one? Ask for a hint and I’ll point you in the right direction, without giving the answer away. Once you’ve checked your answer, I’ll show you how the marks are awarded.