
Level:
Correct: 0
Incorrect: 0
Marks: 0/0
Exam Practice
Course:
Topics:
Edexcel GCSE Statistics (Higher Paper 1) Smart practice A mixed round aimed at your weak spots
Unit 1
The statistical enquiry cycle
Statistical enquiry cycle stages 1 and 2; (a) Planning: 1a.01, 1a.02, 1a.03
Statistical enquiry cycle: planning and collecting
Statistical enquiry cycle stages 3, 4 and 5
Statistical enquiry cycle: interpreting and evaluating
Unit 2
The collection of data
(b) Types of data: 1b.01, 1b.02, 1b.03
Types of data and variables
(b) Types of data: 1b.04; (d) Collecting data: 1d.01, 1d.02
Primary and secondary data, reliability and validity
(c) Population and sampling: 1c.01, 1c.02, 1c.03
Populations, sampling frames and non-random sampling
(c) Population and sampling: 1c.04, 1c.05
Random and systematic sampling
(c) Population and sampling: 1c.06
Stratified sampling
(d) Collecting data: 1d.05, 1d.06
Problems with collected data and cleaning data
Unit 3
Processing, representing and analysing data
(a) Tabulation, diagrams and representation: 2a.01
Tabulation, tallies, pictograms and two-way tables
(a) Tabulation, diagrams and representation: 2a.01, 2a.02
Pie charts and comparative pie charts
(a) Tabulation, diagrams and representation: 2a.01
Stem and leaf diagrams
(a) Tabulation, diagrams and representation: 2a.02
Population pyramids, choropleth maps and 2D and 3D diagrams
(a) Tabulation, diagrams and representation: 2a.04
Histograms and frequency density
(a) Tabulation, diagrams and representation: 2a.05, 2a.06, 2a.07, 2a.08
Choosing representations and misleading diagrams
(a) Tabulation, diagrams and representation: 2a.09, 2a.10
Skewness
(b) Measures of central tendency: 2b.01, 2b.02, 2b.03
Mode, median and mean
(b) Measures of central tendency: 2b.01
Weighted mean and geometric mean
(c) Measures of dispersion: 2c.01, 2c.06
Standard deviation and standardised scores
(a) Tabulation, diagrams and representation: 2a.03; (c) Measures of dispersion: 2c.02, 2c.03
Box plots and outliers
(b) Measures of central tendency: 2b.03; (c) Measures of dispersion: 2c.04, 2c.05
Comparing distributions
(d) Further summary statistics: 2d.01
Index numbers
(d) Further summary statistics: 2d.02
Rates of change
(e) Scatter diagrams and correlation: 2e.01, 2e.02, 2e.03
Scatter diagrams, correlation and causation
(e) Scatter diagrams and correlation: 2e.04
Lines of best fit and regression lines
(e) Scatter diagrams and correlation: 2e.05, 2e.06, 2e.07, 2e.08
Spearman's rank and product moment correlation coefficients
(f) Time series: 2f.01, 2f.02; (b) 2b.01 mean seasonal variation
Time series, moving averages and seasonal variation
(g) Quality assurance: 2g.01, 2g.02
Quality assurance and control charts
(h) Estimation: 2h.01, 2h.02, 2h.03
Estimation, sample size and capture-recapture
Unit 4
Probability
3. Probability: 3p.01, 3p.02, 3p.03, 3p.04
Probability, expected frequency and risk
3. Probability: 3p.05, 3p.06, 3p.10
Experimental and theoretical probability and bias
3. Probability: 3p.11
Binomial distribution
3. Probability: 3p.12, 3p.13
Normal distribution
Avg
score:
–
Topics
done:
0/40

Spearman's rank and product moment correlation coefficients

Practise 19 exam-style questions on Spearman's rank and product moment correlation coefficients for Edexcel GCSE Statistics (Higher Paper 1). Write your answer as you would in the exam and get it marked in seconds against the mark scheme, point by point, with the Study Helper on hand if you get stuck.

  • 19 questions
  • 1–6 marks each
  • Instant marking
  • No sign-up needed
19 questions, marked as you go

Sample questions with model answers

Here are 4 of the questions in this topic, each with a model answer, an explanation of why it earns the marks and the mark scheme an examiner would use.

Question 1

1 mark

A gym recorded the resting heart rates of 12 members who swim and of 12 different members who cycle.

Jack wants to calculate Spearman's rank correlation coefficient between the swimmers' heart rates and the cyclists' heart rates.

Explain why this is not appropriate.

Model answer

A correlation coefficient needs bivariate (paired) data, with two values for each person. These are two separate groups of different people, so a swimmer's heart rate is not paired with any particular cyclist's heart rate.

Explanation

Spearman's coefficient (like the PMCC) compares two variables measured on the same individuals. Two separate samples should be compared using averages and measures of spread instead. Saying the members do different sports is not enough: the key point is that the values are not paired.

Mark scheme
  1. 1 mark

    B1 for the data are not paired (bivariate): each swimmer's heart rate is not linked to a particular cyclist's heart rate, as they are different people

    oe, e.g. 'the two heart rates are not measured on the same people', 'there are no pairs of values'. Must show the idea that correlation needs paired data. Do not accept 'it will measure correlation', 'the samples are too small' or 'they are different sports' on its own.
Question 2

2 marks

In a school art competition, two art teachers each ranked the same 10 paintings from 1st to 10th.

Spearman's rank correlation coefficient for their two sets of ranks is \(-0.81\)

Lena says,
"The value is close to \(-1\), so the two teachers have very similar opinions about the paintings."

Explain why Lena is wrong.

Model answer

The value is negative, so it shows disagreement between the two teachers, not agreement.

A value close to -1 means that the teachers' ranks are nearly in reverse order: paintings that one teacher ranked near the top tended to be ranked near the bottom by the other. Very similar opinions would give a value close to +1.

Explanation

For two judges, +1 means perfect agreement, -1 means completely opposite rankings and 0 means no agreement. A value close to -1 shows strong correlation, but it is strong disagreement. Taking 'strong' to mean 'agree' is a common error.

Mark scheme
  1. 1 mark

    B1 for the value is negative, so it shows disagreement between the teachers' ranks, not agreement

    oe, e.g. 'negative correlation means the teachers disagree'. B0 for 'it shows weak agreement' or 'it shows some agreement'. B0 for arguing only that -0.81 is not close enough to -1.

  2. 1 mark

    B1 for e.g. paintings that one teacher ranked high tended to be ranked low by the other teacher

    oe, e.g. 'the two teachers' ranks are nearly in reverse order', 'a value of -1 would mean exactly opposite rankings'. Accept 'if their opinions were very similar the value would be close to +1, not -1'. Must refer to the rankings or the paintings. Both marks may be earned in one sentence.

Question 3

3 marks

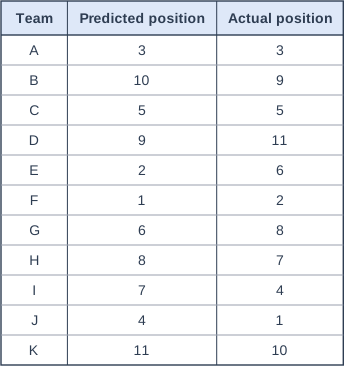
Before a charity quiz night, the quizmaster predicted the finishing position of each of the 11 teams, A to K.

The table shows his predicted positions and the actual finishing positions.

Spearman's rank correlation coefficient \(r_s = 1 - \dfrac{6\sum d^2}{n(n^2 - 1)}\)

Calculate Spearman's rank correlation coefficient between the predicted positions and the actual positions.
Give your answer correct to 2 decimal places.

Table with columns "Team", "Predicted position", "Actual position". Team: A; Predicted position: 3; Actual position: 3 | Team: B; Predicted position: 10; Actual position: 9 | Team: C; Predicted position: 5; Actual position: 5 | Team: D; Predicted position: 9; Actual position: 11 | Team: E; Predicted position: 2; Actual position: 6 | Team: F; Predicted position: 1; Actual position: 2 | Team: G; Predicted position: 6; Actual position: 8 | Team: H; Predicted position: 8; Actual position: 7 | Team: I; Predicted position: 7; Actual position: 4 | Team: J; Predicted position: 4; Actual position: 1 | Team: K; Predicted position: 11; Actual position: 10.

Model answer

d = predicted - actual: 0, 1, 0, -2, -4, -1, -2, 1, 3, 3, 1
\(d^2\): 0, 1, 0, 4, 16, 1, 4, 1, 9, 9, 1
\(\sum d^2 = 46\)

\(r_s = 1 - \dfrac{6 \times 46}{11(11^2 - 1)} = 1 - \dfrac{276}{1320} = 0.7909...\)

\(r_s = 0.79\) (2 decimal places)

Explanation

The positions are already ranks, so find d for each team, square every difference and add. Then substitute into the formula with n = 11. Common errors are squaring the total of the d values (which is always 0), forgetting the '1 -', and using the wrong value of n.

Mark scheme
  1. 1 mark

    M1 for finding the differences and squaring them: \(\sum d^2 = 46\)

    d (predicted - actual): 0, 1, 0, -2, -4, -1, -2, 1, 3, 3, 1 (or the same with signs reversed); d²: 0, 1, 0, 4, 16, 1, 4, 1, 9, 9, 1. Condone one error in the d² values if the method is clear. Implied by 46. Answer-only rule for this question: A correct answer with no working scores full marks (a value from a calculator's statistics functions is acceptable).

  2. 1 mark

    M1 for \(1 - \dfrac{6 \times 46}{11(11^2 - 1)}\) oe

    ft their \(\sum d^2\) from 11 squared differences. Must have '1 -' in the correct place and n = 11.

  3. 1 mark

    A1 for 0.79

    awrt 0.79 (0.790909...); accept \(\dfrac{87}{110}\). 0.8 scores A1 only if 0.790... or better is seen in the working (isw); otherwise A0. A correct answer with no working scores full marks (a value from a calculator's statistics functions is acceptable).

Question 4

4 marks

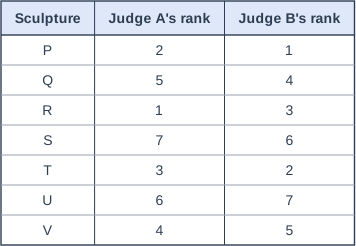
At a beach festival, three judges, Judge A, Judge B and Judge C, each ranked the same 7 sand sculptures, P to V.

The table shows the ranks given by Judge A and by Judge B.

Spearman's rank correlation coefficient between Judge A's ranks and Judge C's ranks is 0.43

Spearman's rank correlation coefficient \(r_s = 1 - \dfrac{6\sum d^2}{n(n^2 - 1)}\)

Which judge, B or C, agrees more closely with Judge A?
You must show your working.

Table with columns "Sculpture", "Judge A's rank", "Judge B's rank". Sculpture: P; Judge A's rank: 2; Judge B's rank: 1 | Sculpture: Q; Judge A's rank: 5; Judge B's rank: 4 | Sculpture: R; Judge A's rank: 1; Judge B's rank: 3 | Sculpture: S; Judge A's rank: 7; Judge B's rank: 6 | Sculpture: T; Judge A's rank: 3; Judge B's rank: 2 | Sculpture: U; Judge A's rank: 6; Judge B's rank: 7 | Sculpture: V; Judge A's rank: 4; Judge B's rank: 5.

Model answer

d (A - B): 1, 1, -2, 1, 1, -1, -1
\(d^2\): 1, 1, 4, 1, 1, 1, 1
\(\sum d^2 = 10\)

\(r_s = 1 - \dfrac{6 \times 10}{7(7^2 - 1)} = 1 - \dfrac{60}{336} = 0.821...\)

Judge B agrees more closely with Judge A, because 0.82 is closer to 1 than 0.43 is.

Explanation

Work out the coefficient for Judges A and B, then compare it with the given value for Judges A and C. The closer the value is to +1, the closer the agreement. A decision without a calculation scores nothing here, because the question asks for working.

Mark scheme
  1. 1 mark

    M1 for finding the squared differences in ranks: \(\sum d^2 = 10\)

    d: 1, 1, -2, 1, 1, -1, -1 (or signs reversed); d²: 1, 1, 4, 1, 1, 1, 1. Condone one error.

  2. 1 mark

    M1 for \(1 - \dfrac{6 \times 10}{7(7^2 - 1)}\) oe

    ft their \(\sum d^2\). Must have '1 -' and n = 7.

  3. 1 mark

    A1 for 0.82 or better (0.82142...)

    Accept \(\dfrac{23}{28}\) or awrt 0.821. Accept 0.8 with correct working seen (the question does not ask for a particular accuracy).

  4. 1 mark

    B1ft for Judge B, because 0.82 is closer to 1 than 0.43 (0.82 > 0.43)

    ft their value of \(r_s\) provided it comes from a complete method and is between -1 and 1. The conclusion must compare their value with 0.43. Answer only (no working) scores 0, as the question says 'You must show your working'.

Ready to try the rest? Every answer you write is marked against the mark scheme, so you can see exactly where the marks are.

Study Helper Hints first, answers after you try

Stuck on this one? Ask for a hint and I’ll point you in the right direction, without giving the answer away. Once you’ve checked your answer, I’ll show you how the marks are awarded.