
Level:
Correct: 0
Incorrect: 0
Marks: 0/0
Exam Practice
Course:
Topics:
Edexcel GCSE Statistics (Higher Paper 1) Smart practice A mixed round aimed at your weak spots
Unit 1
The statistical enquiry cycle
Statistical enquiry cycle stages 1 and 2; (a) Planning: 1a.01, 1a.02, 1a.03
Statistical enquiry cycle: planning and collecting
Statistical enquiry cycle stages 3, 4 and 5
Statistical enquiry cycle: interpreting and evaluating
Unit 2
The collection of data
(b) Types of data: 1b.01, 1b.02, 1b.03
Types of data and variables
(b) Types of data: 1b.04; (d) Collecting data: 1d.01, 1d.02
Primary and secondary data, reliability and validity
(c) Population and sampling: 1c.01, 1c.02, 1c.03
Populations, sampling frames and non-random sampling
(c) Population and sampling: 1c.04, 1c.05
Random and systematic sampling
(c) Population and sampling: 1c.06
Stratified sampling
(d) Collecting data: 1d.05, 1d.06
Problems with collected data and cleaning data
Unit 3
Processing, representing and analysing data
(a) Tabulation, diagrams and representation: 2a.01
Tabulation, tallies, pictograms and two-way tables
(a) Tabulation, diagrams and representation: 2a.01, 2a.02
Pie charts and comparative pie charts
(a) Tabulation, diagrams and representation: 2a.01
Stem and leaf diagrams
(a) Tabulation, diagrams and representation: 2a.02
Population pyramids, choropleth maps and 2D and 3D diagrams
(a) Tabulation, diagrams and representation: 2a.04
Histograms and frequency density
(a) Tabulation, diagrams and representation: 2a.05, 2a.06, 2a.07, 2a.08
Choosing representations and misleading diagrams
(a) Tabulation, diagrams and representation: 2a.09, 2a.10
Skewness
(b) Measures of central tendency: 2b.01, 2b.02, 2b.03
Mode, median and mean
(b) Measures of central tendency: 2b.01
Weighted mean and geometric mean
(c) Measures of dispersion: 2c.01, 2c.06
Standard deviation and standardised scores
(a) Tabulation, diagrams and representation: 2a.03; (c) Measures of dispersion: 2c.02, 2c.03
Box plots and outliers
(b) Measures of central tendency: 2b.03; (c) Measures of dispersion: 2c.04, 2c.05
Comparing distributions
(d) Further summary statistics: 2d.01
Index numbers
(d) Further summary statistics: 2d.02
Rates of change
(e) Scatter diagrams and correlation: 2e.01, 2e.02, 2e.03
Scatter diagrams, correlation and causation
(e) Scatter diagrams and correlation: 2e.04
Lines of best fit and regression lines
(e) Scatter diagrams and correlation: 2e.05, 2e.06, 2e.07, 2e.08
Spearman's rank and product moment correlation coefficients
(f) Time series: 2f.01, 2f.02; (b) 2b.01 mean seasonal variation
Time series, moving averages and seasonal variation
(g) Quality assurance: 2g.01, 2g.02
Quality assurance and control charts
(h) Estimation: 2h.01, 2h.02, 2h.03
Estimation, sample size and capture-recapture
Unit 4
Probability
3. Probability: 3p.01, 3p.02, 3p.03, 3p.04
Probability, expected frequency and risk
3. Probability: 3p.05, 3p.06, 3p.10
Experimental and theoretical probability and bias
3. Probability: 3p.11
Binomial distribution
3. Probability: 3p.12, 3p.13
Normal distribution
Avg
score:
–
Topics
done:
0/40

Scatter diagrams, correlation and causation

Practise 15 exam-style questions on Scatter diagrams, correlation and causation for Edexcel GCSE Statistics (Higher Paper 1). Write your answer as you would in the exam and get it marked in seconds against the mark scheme, point by point, with the Study Helper on hand if you get stuck.

  • 15 questions
  • 1–5 marks each
  • Instant marking
  • No sign-up needed
15 questions, marked as you go

Sample questions with model answers

Here are 4 of the questions in this topic, each with a model answer, an explanation of why it earns the marks and the mark scheme an examiner would use.

Question 1

1 mark

A computer repair shop recorded the age, in years, and the battery life, in hours, of 12 laptops of the same model.

The scatter diagram shows this information.

Write down the type of correlation shown by the scatter diagram.
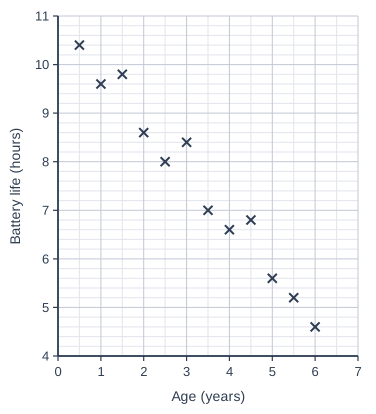
Scatter graph on a grid of small squares. The horizontal axis is "Age (years)", from 0 to 7, numbered every 1, with 2 small squares between numbered values (each small square is 0.5). The vertical axis is "Battery life (hours)", from 4 to 11, numbered every 1, with 5 small squares between numbered values (each small square is 0.2). 12 points are plotted as crosses: (0.5, 10.4), (1, 9.6), (1.5, 9.8), (2, 8.6), (2.5, 8), (3, 8.4), (3.5, 7), (4, 6.6), (4.5, 6.8), (5, 5.6), (5.5, 5.2) and (6, 4.6).

Model answer

Negative correlation.

(As the age of a laptop increases, its battery life tends to decrease.)

Explanation

The points go down from left to right, so the correlation is negative: older laptops tend to have a shorter battery life. The type of correlation is positive, negative or no correlation, so the answer must use the word negative; describing the pattern in words is not enough on its own.

Mark scheme
  1. 1 mark

    B1 for negative (correlation)

    Ignore references to strength, e.g. 'strong negative' scores B1. The word negative is needed: a description of the pattern alone, e.g. 'as the age increases the battery life decreases', does not answer 'the type of correlation' and scores B0. Positive correlation or no correlation scores B0.
Question 2

2 marks

Nadia has collected data on 20 breakfast cereals. For each cereal she has the sugar content, in grams per 100 g, and the price per 100 g.

She wants to find out whether there is an association between the sugar content and the price.

Suggest a suitable diagram for Nadia to use. Give a reason for your choice.

Model answer

A scatter diagram.

The data are bivariate (paired): each cereal has two values, its sugar content and its price, so each cereal can be shown as one point and the diagram will show any correlation between sugar content and price.

Explanation

A scatter diagram is used for bivariate (paired) data, where two variables are measured for each item. Saying the data are continuous, or that the diagram compares two data sets, does not explain the choice: the key idea is that the values come in pairs, one pair for each cereal.

Mark scheme
  1. 1 mark

    B1 for scatter diagram

    Accept scatter graph or scatter plot. Do not accept line graph, bar chart, 'a line of best fit' or 'correlation'.

  2. 1 mark

    B1 for a reason, e.g. the data are bivariate / paired (each cereal has two values: its sugar content and its price) / it will show any correlation between sugar content and price

    Dependent on the first B1. oe, e.g. 'two variables are measured for each cereal'. Do not accept 'the data are continuous', 'it compares two sets of data' or 'it is easy to read': these do not say that the values come in pairs.

Question 3

3 marks

Grace's hypothesis is
"Students who take longer to travel to school are late more often."

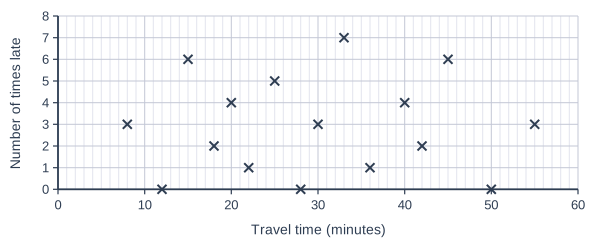
For 16 students, she recorded the time each student takes to travel to school and the number of times each student was late last term.

The scatter diagram shows her results.

Does the scatter diagram support Grace's hypothesis? Give a statistical reason for your answer.

Scatter graph on a grid of small squares. The horizontal axis is "Travel time (minutes)", from 0 to 60, numbered every 10, with 10 small squares between numbered values (each small square is 1). The vertical axis is "Number of times late", from 0 to 8, numbered every 1. 16 points are plotted as crosses: (8, 3), (12, 0), (15, 6), (18, 2), (20, 4), (22, 1), (25, 5), (28, 0), (30, 3), (33, 7), (36, 1), (40, 4), (42, 2), (45, 6), (50, 0) and (55, 3).

Model answer

No.

The scatter diagram shows no correlation between travel time and the number of times late, so it does not support Grace's hypothesis. Students with long journeys were not late more often than students with short journeys.

Explanation

To support the hypothesis, the diagram would need to show positive correlation. The points are scattered with no pattern, so there is no correlation and the hypothesis is not supported. A decision (yes or no) on its own scores nothing: it needs the statistical reason, 'no correlation', and an interpretation in context.

Mark scheme
  1. 1 mark

    B1 for no correlation

    Accept zero correlation, little or no correlation, no association. Condone 'very weak correlation'. B0 for positive or negative correlation (including 'weak positive').

  2. 1 mark

    B1 for the hypothesis is not supported

    Dependent on the first B1. oe, e.g. 'No'. A decision with no statistical reason scores B0 B0.

  3. 1 mark

    B1 for an interpretation in context, e.g. students with long journeys were not late more often than students with short journeys

    oe, e.g. 'the number of times a student was late does not seem to be related to their travel time', 'some students with short journeys were late many times and some with long journeys were not late at all'. Must refer to travel time and lateness. Do not accept a restatement of the hypothesis.

Question 4

4 marks

Leah's hypothesis is
"The more rain there is in a month, the fewer people visit the outdoor museum."

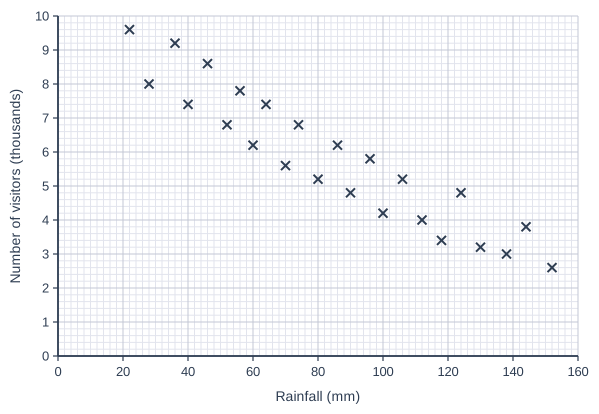
For 24 months, she recorded the total rainfall, in mm, and the number of visitors to the museum, in thousands.

The scatter diagram shows her results.

Explain whether the scatter diagram supports Leah's hypothesis.

Leah concludes that the rain is the reason why the number of visitors changes from month to month.
Give a reason why Leah may be wrong. In your answer, name one other factor that could affect the number of visitors.

Scatter graph on a grid of small squares. The horizontal axis is "Rainfall (mm)", from 0 to 160, numbered every 20, with 10 small squares between numbered values (each small square is 2). The vertical axis is "Number of visitors (thousands)", from 0 to 10, numbered every 1, with 5 small squares between numbered values (each small square is 0.2). 24 points are plotted as crosses: (22, 9.6), (28, 8), (36, 9.2), (40, 7.4), (46, 8.6), (52, 6.8), (56, 7.8), (60, 6.2), (64, 7.4), (70, 5.6), (74, 6.8), (80, 5.2), (86, 6.2), (90, 4.8), (96, 5.8), (100, 4.2), (106, 5.2), (112, 4), (118, 3.4), (124, 4.8), (130, 3.2), (138, 3), (144, 3.8) and (152, 2.6).

Model answer

Yes. The scatter diagram shows negative correlation: months with more rain tend to have fewer visitors, which supports Leah's hypothesis.

However, correlation does not mean causation, and the number of visitors may be affected by several factors at the same time. For example, the time of year: wetter months are often in autumn and winter, when it is colder, the days are shorter and there are no long school holidays, so fewer people would visit anyway.

Explanation

First give the type of correlation and the decision it leads to. Then remember that a correlation, however strong, does not show cause: here the season, temperature and school holidays change together with the rainfall and may also affect the number of visitors. The factor named must be one that could affect visitor numbers.

Mark scheme
  1. 1 mark

    B1 for negative correlation

    Ignore references to strength. The type of correlation must be named: a description in words alone, e.g. 'months with more rain have fewer visitors', only restates the hypothesis and scores B0 (and then the dependent B1 cannot be scored).

  2. 1 mark

    B1 for the scatter diagram supports Leah's hypothesis

    Dependent on the first B1. oe, e.g. 'Yes'.

  3. 1 mark

    B1 for correlation does not imply causation / other factors may also affect the number of visitors

    oe, e.g. 'the correlation does not prove the rain causes the change', 'several factors could be changing at the same time'.

  4. 1 mark

    B1 for naming another factor that could affect the number of visitors, e.g. the time of year / season / temperature / school holidays / daylight or opening hours / special events / ticket price

    The factor must be one that could plausibly change the number of visitors. Credit a link to rainfall if given (e.g. 'wetter months are often in winter, when it is colder and there are no long school holidays') but it is not required. Do not accept 'rain' or 'the amount of rainfall', or 'other factors' with no example.

Ready to try the rest? Every answer you write is marked against the mark scheme, so you can see exactly where the marks are.

Study Helper Hints first, answers after you try

Stuck on this one? Ask for a hint and I’ll point you in the right direction, without giving the answer away. Once you’ve checked your answer, I’ll show you how the marks are awarded.